From around the world, we have more evidence that people are shifting from checks to other means of noncash payments. Using data from the Bank for International Settlements (BIS)![]() , my Atlanta Fed colleagues Antar Diallo and Oz Shy found that from 2012 to 2021, in all 20 countries they examined, the number of checks declined as the number of cashless payments increased. Since checks are cashless payment instruments, it's notable that the total of cashless payments increased even as a component of this calculation declined.
, my Atlanta Fed colleagues Antar Diallo and Oz Shy found that from 2012 to 2021, in all 20 countries they examined, the number of checks declined as the number of cashless payments increased. Since checks are cashless payment instruments, it's notable that the total of cashless payments increased even as a component of this calculation declined.
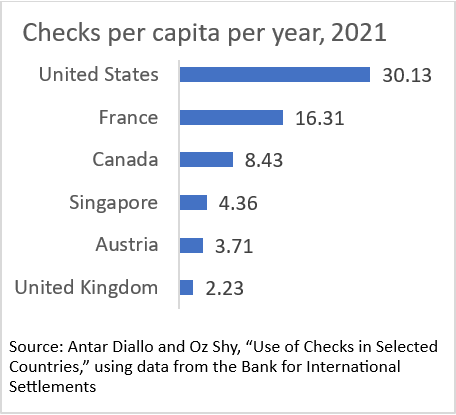
Among the 20 countries that reported the number and value of these payments to the BIS, the United States had by far the highest per capita use of checks per year in 2021: 30 checks. Only six countries reported more than two per capita (chart below), another 12 between zero and two. Belgium and South Africa reported zero.
Yikes, you say, 30 checks per person per year in 2021! How is that possible? About half of checks in the United States are estimated to be written by businesses, according to the Atlanta Fed's Check Sample Survey
Given the high per capita use in the United States, it makes sense that our year-over-year decline from 2012 has been slower than that for other countries. The per-year decline in the number of U.S. checks from 2012 to 2021 was slower than the decline for all the other high-use countries listed in the chart. The United States was down 6.7 percent per year from 2012 to 2021, compared to down 8.8 percent per year for Canada at the slow end and down 17.4 percent per year for Austria at the quick end.
No way around it: we love our checks, and our response to innovation has been tepid compared to that of other countries.

By Claire Greene, payments risk expert in the Retail Payments Risk Forum at the Atlanta Fed