The Atlanta Fed has just launched the Labor Market Sliders, a tool to help explore simple "what if" questions using actual data on employment, the unemployment rate, labor force participation, gross domestic product (GDP) growth, and labor productivity (GDP per worker).
We modeled the Labor Market Sliders after the popular Atlanta Fed Jobs Calculator. In particular, the sliders take the rate of labor productivity growth and the rate of labor force participation as given (not a function of GDP or employment growth) and then asks questions about GDP growth and labor market outcomes. Like the Jobs Calculator, the sliders require that things add up, a very useful feature for all those backyard economic prognosticators (we know you're out there).
Let's look at an example of using the sliders. The Congressional Budget Office (CBO) projects![]() that the labor force participation rate (LFPR) will maintain roughly its current level of 62.9 percent during the next couple of years, as the downward pressure of retiring baby boomers and the upward pressure from robust hiring hold the rate stable. The CBO also projects that labor productivity growth will gradually increase to almost 1 percent over roughly the same period.
that the labor force participation rate (LFPR) will maintain roughly its current level of 62.9 percent during the next couple of years, as the downward pressure of retiring baby boomers and the upward pressure from robust hiring hold the rate stable. The CBO also projects that labor productivity growth will gradually increase to almost 1 percent over roughly the same period.
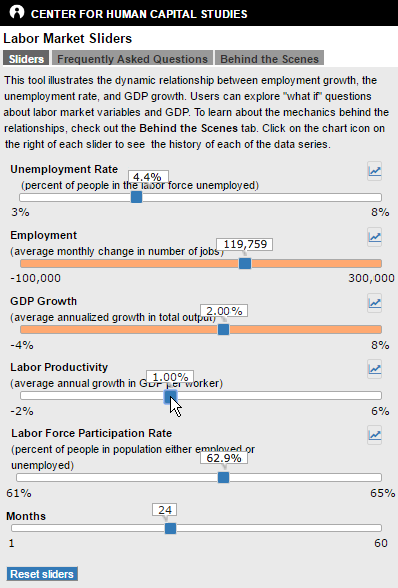
Suppose we want to know what GDP growth would be over the next couple of years (other things equal) if labor productivity, which has been sluggish lately, returned to 1 percent, as projected by the CBO. By moving the Labor Productivity slider in the tool to 1 percent and the Months slider to 24, you will see how productivity alone affects GDP growth: it increases to about 2 percent (see the image below). In this experiment, the unemployment rate, average job growth, and LFPR are constrained to current levels.
However, there's more than one way to achieve GDP growth of 2 percent over the next two years. Let's take a look.
Hit the reset button, and productivity, GDP growth, and months revert to their starting values. Then move the Months slider to 24 and the GDP Growth slider to 2 percent. You then see that—at current levels of labor force participation and labor productivity growth—achieving 2 percent GDP growth over the next two years would require the economy to create about 200,000 jobs per months (see the image below), which would push the unemployment rate down to 3.1 percent (a rate not seen since the early 1950s).

Hit the reset button again. Achieving 2 percent GDP growth over the next two years is also realistic with a higher LFPR, some other things equal. First, move the Months slider to 24, then move the Labor Force Participation Rate slider to 63.7 percent. The higher LFPR is consistent with about 2 percent growth in GDP and roughly 200,000 additional jobs added each month (see the image below). (This scenario constrains the unemployment rate and labor productivity growth rate to their current levels.) Of course, we haven't seen the LFPR at 63.7 percent since 2012, but that's another discussion.

What if we wanted something a bit more ambitious, such as averaging 3 percent GDP growth over the next couple of years? Hit the reset button again, and try this scenario. Keep Labor Force Participation Rate at its current level (consistent with the CBO's projection), set Labor Productivity growth to 1 percent (also using the CBO projection as a guide), move the Months slider to 24, and the GDP Growth slider to 3 percent. The Labor Market Sliders allow us to see that the economy would need to add an average of about 240,000 jobs each month for those two years. This scenario, the tight-labor-market method of achieving 3 percent GDP growth, would bring the unemployment rate down to 2.6 percent.
However, suppose the United States were somehow able to recapture productivity growth of around 2 percent, which we experienced in the late 1990s and early 2000s. In that case, 3 percent GDP could be achieved at the current employment growth and unemployment rate.
I encourage you to play around and devise your own "what if" scenarios—and use the Labor Market Sliders to make sure they add up.
 Julie L. Hotchkiss, a research economist and senior policy adviser in the Atlanta Fed's research department