
The 2022 Federal Reserve Payments Study in Four Charts
June 26, 2023


Today, the numbers can do the talking about noncash payments in 2021.
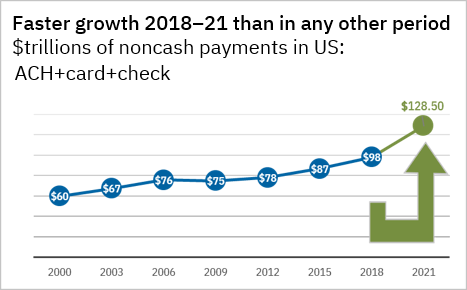
The chart below shows the value of noncash payments from the first measurement year of the Federal Reserve Payments Study, 2000, to the latest, 2021. Noncash payments grew more from 2018 to 2021 than in any prior three-year measurement period: 9.5 percent per year from 2018 to 2021.
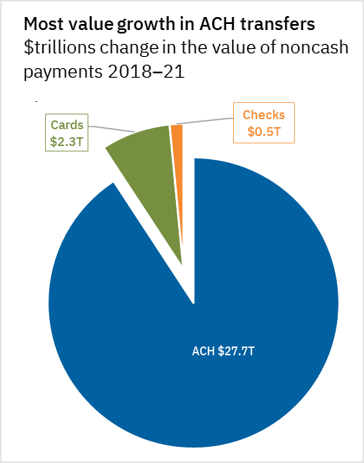
The next chart shows the share of the increase in the value of noncash payments attributable to ACH transfers, card payments, and checks. Most of the growth—91 percent—was in ACH transfers, which increased by $27.7 trillion to $91.85 trillion.
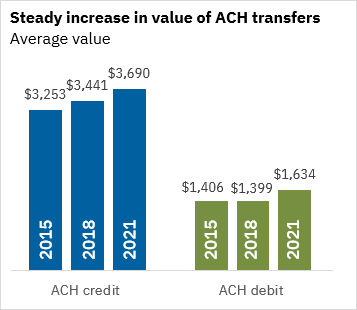
Both ACH credit and ACH debit transfers grew more than 12 percent per year in value from 2018—faster value growth than card or check. The next chart shows the growth in the average values of ACH credit and debit transfers.
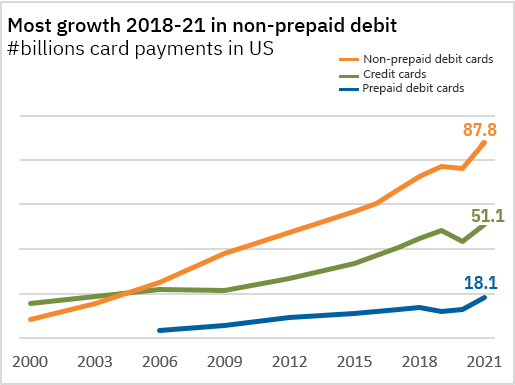
The number of noncash payments also increased from 2018 to 2021, up by 5.6 percent per year. Most of the number growth was in card payments. The increase in the number of card payments accounted for more than 84% of the growth in the number from 2018 to 2021.
If you, like me, enjoy playing around with Excel to make pictures of data, you can download the latest data. You can also review this downloadable infographic.
Happy charting.