
Better Data, Better Outcomes: Lessons for Workforce Programs
November 17, 2026


Workforce Currents 2026-05
Digital Object Identifier: https://doi.org/10.29338/wc2026-05
Key Points
- Collecting Systematic, Longitudinal Data
Programs should collect participant and outcome data over time to understand who they serve and whether their interventions have lasting impact. Longitudinal measurement enables informed, evidence-based decisions. - Valuing Unexpected Findings
Results that differ from expectations can reveal gaps or disparities that deserve attention. These findings provide opportunities to refine programming. - Designing Questions That Measure Impact
Clear, well‑crafted survey and interview questions improve the accuracy and usefulness of evaluation data. Thoughtful design helps ensure data reflects both participant experience and program contribution. - Listening for Qualitative Insights
Qualitative feedback uncovers nuance that numbers alone cannot capture. Even simple check‑ins can highlight barriers, inform improvements, and strengthen participant outcomes. - Investing in Data Infrastructure
Building intentional data systems requires time and resources but yields long‑term benefits for program improvement and external accountability. Strong data practices help organizations demonstrate impact and guide strategic decisions.
Better data for better program outcomes
Is your workforce development program achieving its intended impact? While most programs collect some data, it is critical to design collection and analysis systems with clear evaluation goals in mind. Such data systems and intentional analysis can provide information on program participants, outputs, and outcomes that enable organizations to evaluate program effectiveness and make informed, evidence-based decisions about deploying resources for maximum impact. In today's rapidly evolving labor market, particularly with the emergence and integration of artificial intelligence, robust measurement and evaluation strategies are essential for workforce programs to remain responsive to the needs of both employers and the communities they serve.
This case study examines the data and measurement strategy from one such workforce development program, Can Code, that has put their data to work. Can Code1 is an adult digital skills training provider that aims to reach populations that traditional tech pipelines miss, like older workers, rural Americans, and first-generation college students (among others). Can Code partnered with the Federal Reserve Bank of Atlanta (Atlanta Fed) to complete an analysis of their program data for information on outcomes in adult digital skills training programs. Through this examination of Can Code's data collection practices and the insights they have generated, we explore how evidence-based learning has shaped their programmatic approach.
Organizations seeking to measure their impact often face what Gugerty and Karlan describe as "the Goldilocks Challenge" where organizations must balance rigorous but costly evaluation with overly simplistic measurement to find the "just right" approach.2 Effective program evaluation may not require the rigor of a randomized control trial, but it does require intentionality and commitment for the practice to be useful and accurate. By examining how Can Code collects, interprets, and acts on program data, this case study describes how they have sought to find the "just right" approach and illustrates both the transformative potential of data-informed decision-making and the practical challenges organizations face in building effective evaluation systems. Readers will discover actionable strategies and proven lessons that can be adapted to strengthen their own program evaluation efforts.
Digital skills and workforce development
Digital skills are increasingly necessary for accessing jobs and career pathways that provide opportunities to economic mobility. National Skills Coalition and the Atlanta Fed found that 92 percent of jobs require foundational or more advanced digital skills; and transitioning from a job that requires no digital skills to a job that requires one digital skill increases pay by 23 percent, on average.3 Studies published by Atlanta Fed also find that artificial intelligence (AI) is rapidly changing the skill DNA of jobs.4 Yet, one in three workers lack the digitals skills that facilitate access to career pathways and economic mobility.5
Adult training programs are critical to meet the workforce needs of employers and to support a thriving economy that works for everyone. For the Atlanta Fed, the success of adult training programs aligns with the maximum employment portion of the System's dual mandate, particularly as the future of work continues to shift with the rapid increase in AI utilization. The Federal Reserve System recently convened focus groups with workers in low-to moderate-income households to understand their perspectives and experience in the economy and the labor market. When asked about finding and maintaining jobs, several participants lamented feeling like they didn't have the skills or credentials required of many available jobs. However, most also felt that formal post-secondary education was out of reach due to the cost and time commitment involved which would prevent them from working, attending to childcare, and other responsibilities.6 Organizations that offer short-term classes designed with this population in mind are critical to support a workforce that meets the needs of employers and that creates economic resilience and mobility for individuals. Can Code, a digital skills workforce training provider, is one of many such organizations that are working to fill this gap. According to Can Code, they have supported roughly 6,000 learners since its inception in 2016 across various programs including youth programs, professional development programs, and adult workforce training programs—to name a few. The focus of this study is the adult workforce training programs which have supported 1,479 adult learners from 2016 to March 2026 and aims to create "a vibrant, inclusive, talent-fueled tech sector."7
Case study: Can Code communities—measuring for success
Opportunity changes everything. Can Code program participant
Can Code believes that everyone belongs in tech, providing digital skills training to students of all ages and backgrounds. Live instruction courses are offered virtually to maximize accessibility, and 98 percent of their students receive tuition assistance covering the entire cost of the program. Additionally, Can Code provides laptop and hotspot lending for students who don't have access to devices or internet to the location of the candidate's choosing, including shelters or transitional housing. The organization offers two training tracks: basic computer skills training for those with limited technology experience and advanced software development courses. Advanced offerings include subjects such as Python, web development, and a recently added course on AI fundamentals. Finally, their employer advisory council connects many students with internships and interviews to assist them in finding jobs following course completion.
Can Code has prioritized data collection and evaluation to understand whether participants are experiencing successful outcomes. Prior to the start of class and upon enrollment, students complete an intake survey that captures baseline information including demographics, educational background, current employment, current salary (if employed), and reason for enrolling. Following course completion, Can Code conducts follow-up surveys every three months for the first year, then at 18 months, and 24 months to track participants' success in the labor market, including whether they have secured employment, the sector it is in, position obtained, and salary information. This longitudinal approach allows the organization to measure not just immediate outcomes but also sustained impact over time.
Can Code tracks student outcomes from their basic computer skills track and software track separately. Figure 1 summarizes the number of respondents and response rates to the periodic employment surveys from both tracks. For both tracks, the first two surveys have the highest response rate, then there is a significant dip at nine months onward, except for the software track where there is a substantive uptick at 12 months followed by another dip. It is important to note that a reduction in response rate could bias data if it is not random. It could be the case that former students who drop out of the survey systematically differ from students who continue to participate. Longitudinal surveys like these could be strengthened by assessing differences between attriters and non-attriters. For this analysis, we examined de-identified survey data that Can Code shared with the Atlanta Fed and is based on students who took classes in the software track as this track has a more robust response rate compared to the basic computer skills track. As a side note, the following sections analyze student enrollment by characteristics and students' economic outcomes. The enrollment analyses aggregate the full range of data, but for robustness, the outcomes analyses limit the aggregation to the first 12 months of responses.
Figure 1 Response Counts (Rates) of Periodic Employment Surveys 2016-2025, Count (Percent)
| Employment Survey at X Period Post-Enrollment | Basic Computer Skills Track | Software Track |
|---|---|---|
| 3 Months | 48 (10%) | 202 (20%) |
| 6 Months | 45 (9%) | 137 (14%) |
| 9 Months | 5 (1%) | 64 (6%) |
| 12 Months | 10 (2%) | 132 (13%) |
| 18 Months | 1 (0.2%) | 76 (8%) |
Source: Authors' calculation of Can Code data.
Note: Can Code began enrolling students in its basic computer skills program in 2020. Through March 2026, it enrolled 480 adult learners in its basic computer skills program. Can Code began enrolling students in its software program in 2016. Through March 2026, it enrolled 999 adult learners in its software program.
Case 1: Enrollment findings and informed decision-making
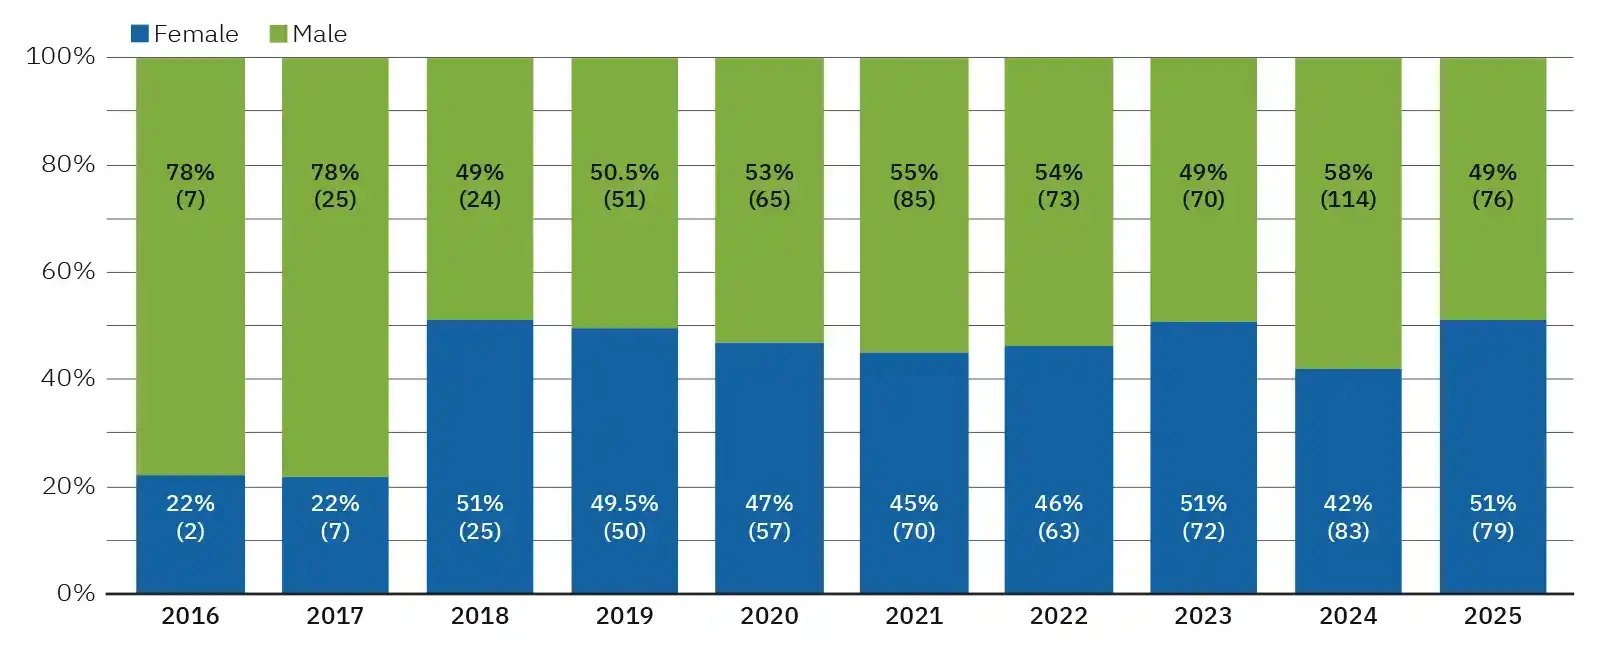
From the outset, Can Code collected demographic data from its learners. The organization leveraged that data to understand who it serves, to consider the kinds of support its learners may need, and to ensure the opportunity for economic mobility is available to various groups. In the early years of Can Code, participant data revealed that its software training courses were predominately taken by men (figure 2), despite their goal to help fuel an inclusive technology sector.8 In response to this finding, Can Code began targeted recruitment of women, who currently represent just 27 percent of employment in STEM fields.9 As a result of their change in recruitment strategy, the program's gender breakdown has been roughly equivalent since 2018, a trend that continues through the latest available data.
Figure 2 Software Training Enrollment by Gender 2016-2025, Percent (Count)
Additionally, with data going back to 2017, Can Code found that their courses were predominantly taken by white learners (figure 3). Can Code responded to this gap by launching recruitment efforts targeting non-white prospective students. These initiatives leveraged partnerships with trusted local community organizations, including public schools, employers, community-based organizations, and workforce development agencies. By working through these established community partners, Can Code was able to reach potential students who might not otherwise have known about the program and who may have historically been unable to access technology career pathways.
Figure 3
Software Training Enrollment by Race and Ethnicity
2016-2025, Percent (Count)
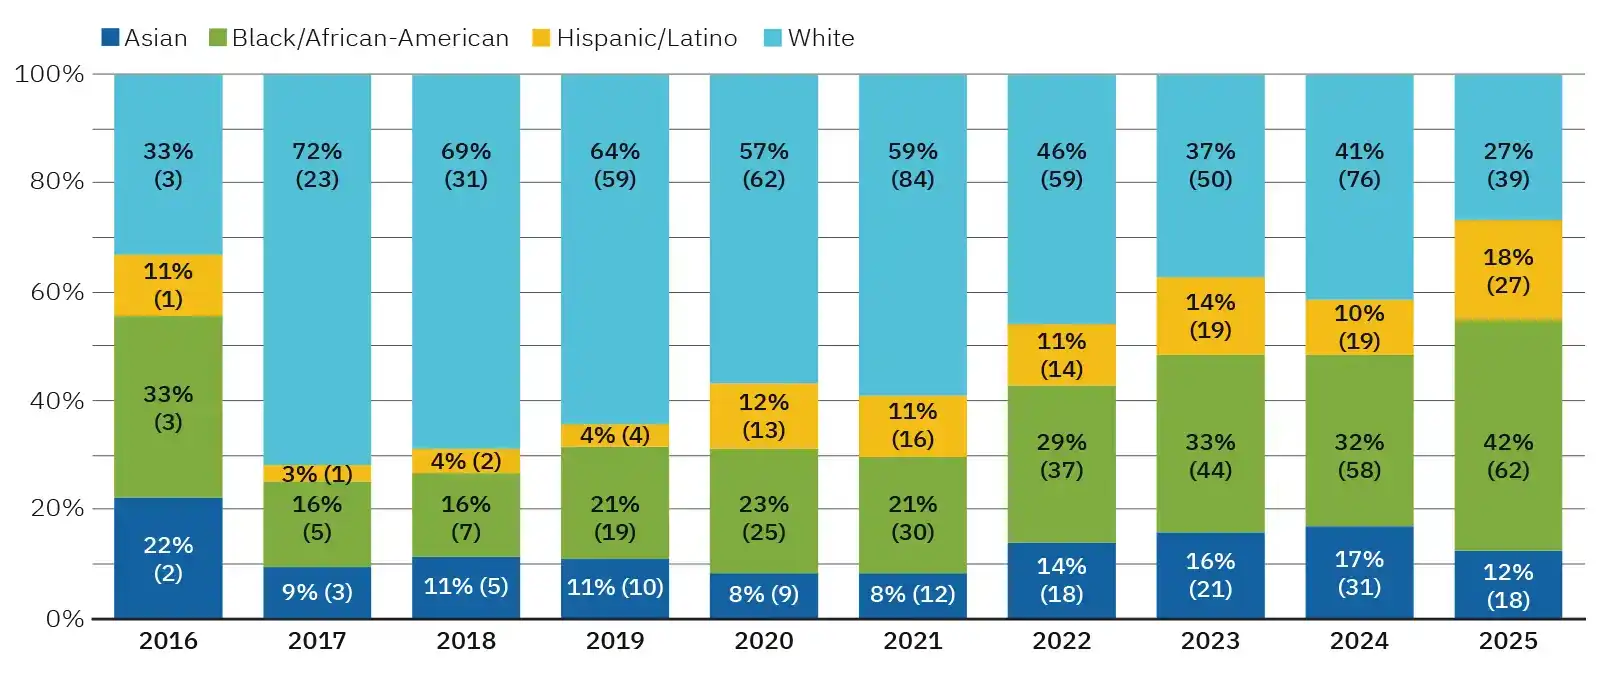
It is important to note that Can Code took a "grow the pie" approach to diversifying the demographics of its leaners. Figures 1 and 2 show that while the proportions of its male and white learners changed, the organization continues to support a substantial percentage of these groups by increasing the overall number of participants. However, we see racial and ethnic diversity ebb and flow over the years, suggesting granular targeted recruitment efforts require periodic reevaluation.
The demographic shifts achieved by Can Code over the last several years illustrate the critical role that program data plays in driving meaningful improvement in workforce program utilization. By regularly examining who was and was not accessing their services, Can Code was able to develop evidence-based understanding of program utilization patterns across different populations and take action based on those findings.
Case 2: What you ask vs. how you ask
In addition to ensuring a program is reaching its target population on the front end, it is just as critical to track outcomes and impact. For Can Code, this means tracking the employment and salary outcomes of program participants to understand if completing their classes leads to employment, increases employment in the technology sector, and increases income. Can Code has learned through trial and error that when tracking outcomes, it is critical to design data collection tools that clearly demonstrate a link between the program and student outcomes.
In its post-enrollment survey, an employment question (see below, figure 4) was intended to measure the impact Can Code courses have on job attainment. While the wording of the question is intuitive, it is not precisely enough worded to adequately measure the efficacy of the program. At face value, 64 percent of students reported having a new employer within one-year post-class (figure 5—Panel A). While it could be the case that almost two-thirds of students successfully found new employment thanks to Can Code's development program, that new employment could also be due to any number of other factors. For instance, some students may have landed employment post-class that is unrelated to their Can Code studies. Figure 6 shows alternative employment questions with more specific if/then statements that suggest the student's result can be connected to the impact of the program.
Figure 4
Can Code Employment Survey Question
Post-enrollment Question
- 4. Tell us about your current employment.
- I am currently employed (skip to question 5)
- I am employed with the same employer and have the same job title as when I started my CanCode class. (skip to question 10)
- I have a new employer and/or job title than when I started my CanCode class. (skip to question 6)
Source: Question from the Can Code post-enrollment survey, 2016-2025*.
Figure 5 (Panels A-C)
Sampling of Employment Questions
2016-2025, Percent
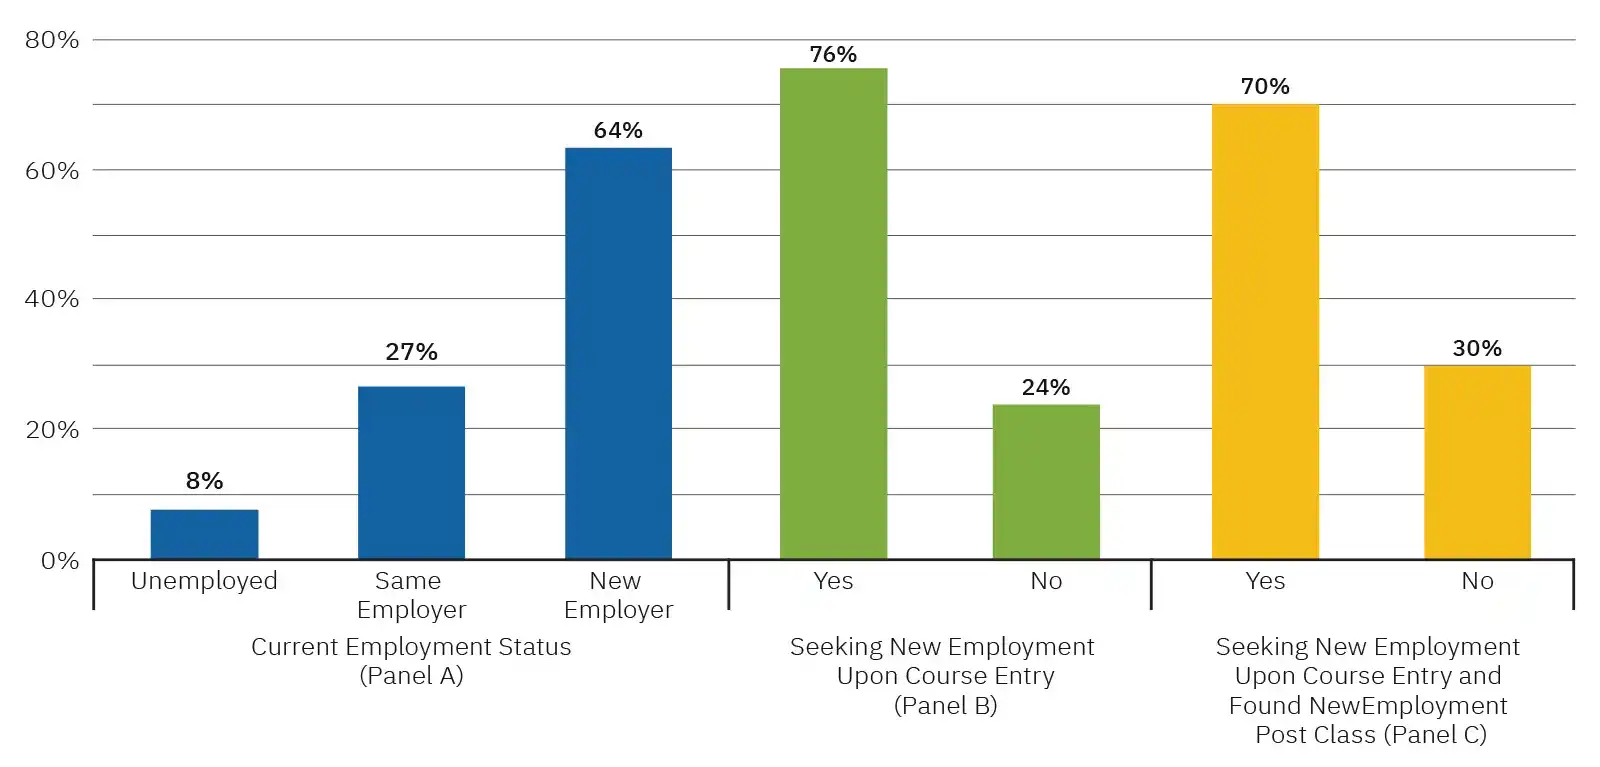
Note: Panel C is a crosstabulation limited to students who responded, "Yes," to the question in Panel B.
Figure 6 Alternative Employment Survey Questions
- 1a) Tell us about your current employment.
- I am currently unemployed.
- I am currently employed.
- 1b) If you are employed, which statement is most true about your employment situation?
- I have a new job because of the course(s) I completed through Can Code.
- I have a new job, but it is unrelated or unattributable to Can Code.
- I have the same job with new responsibilities because of the course(s) I completed through Can Code.
- I have the same job with new responsibilities, but it is unrelated or unattributable to Can Code.
- Can Code had no effect on my employment.
- 1c) If you found a new job because of Can Code, is it with a new employer?
Source: Question from the Can Code post-enrollment survey, 2016-2025*.
When working with data points that provide limited results, it's possible to rely on cross-tabulations as a temporary solution. Cross-tabulations compare two pieces of information at once. For example, figure 5—Panel C is a cross-tabulation that brings us closer to being able to attribute new employment to the Can Code program by measuring the number of students who said they were looking for new jobs at the time they entered the program and with the number of students who found new jobs within one-year post-class. This cross-tabulation shows us that 70 percent of students seeking employment found it within one year of completing a Can Code course. While closer to a ground truth, it still lacks precision given the many confounding macro and microeconomic factors that lead to employment. Nonetheless, inferences from cross-tabulations like this are useful in two important ways. When recruiting prospective students, the data suggests that Can Code courses may yield a positive return on their time and financial investment, helping to attract students who may be hesitant about their ability to transition into new careers. Additionally, for donor and grant cultivation and retention, these outcomes may suggest a measurable return on investment.
Case 3: Using program data to increase impact
Because Can Code captures demographic information, cross-tabulations can provide the "just right" insights into the employment outcomes of the organization's diverse learning community. In this case, although an aggregate 70 percent of Can Code learners seeking new employment achieve it (figure 5), there is a gender gap with 68 percent of female learners find success compared to 74 percent of male learners (figure 7—Panel A). Figure 7—Panel B reveals a wider gap (15 percentage points) between the employment outcomes of learners without and with a bachelor's degree or higher.
Figure 7 (Panels A-B)
Employment Status by Characteristics
2016-2025, Percent
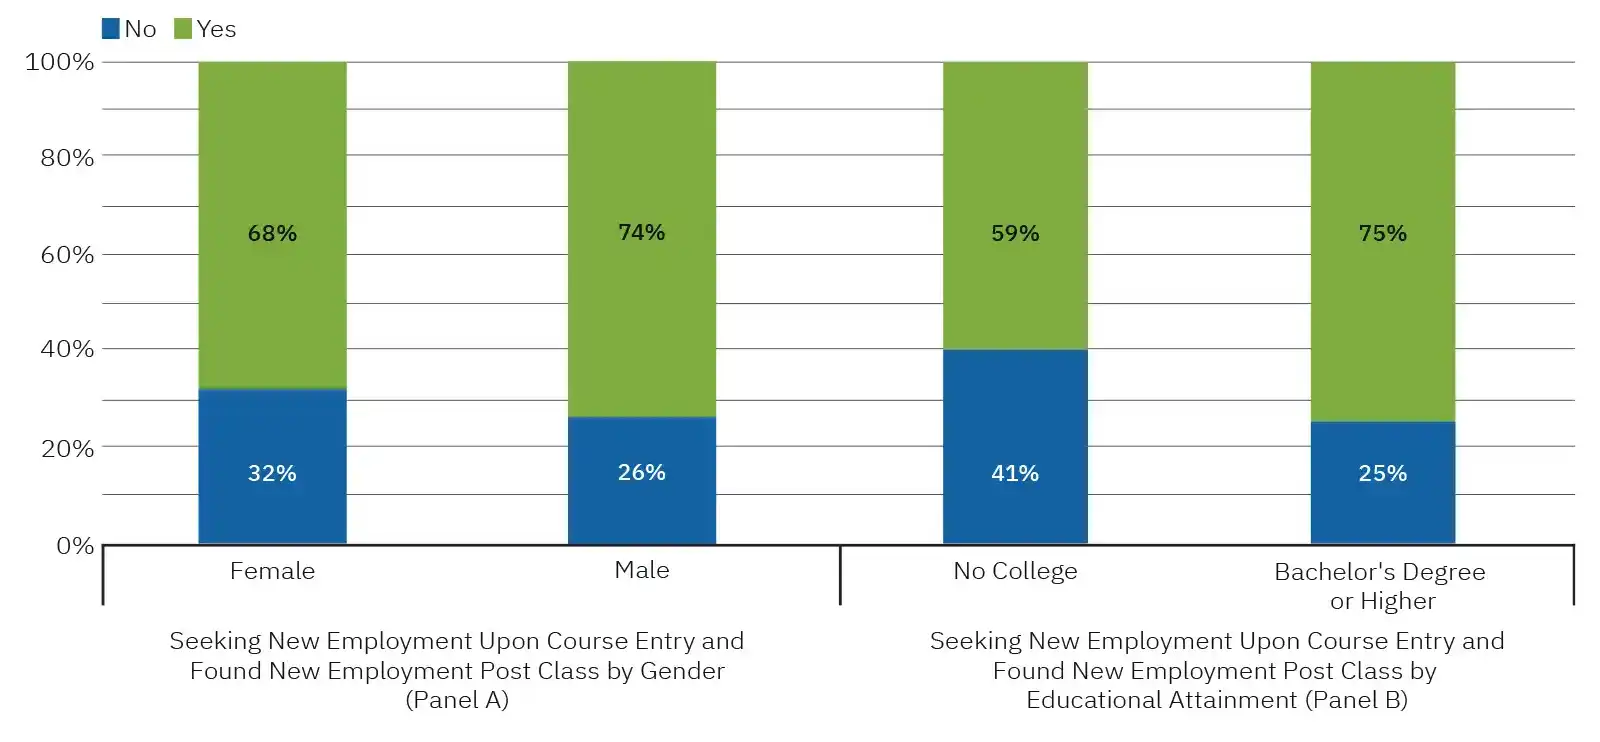
Note: Panels A and B are crosstabulations limited to students who responded, "Yes," to the pre-class question that asks if they are seeing new employment upon course entry.
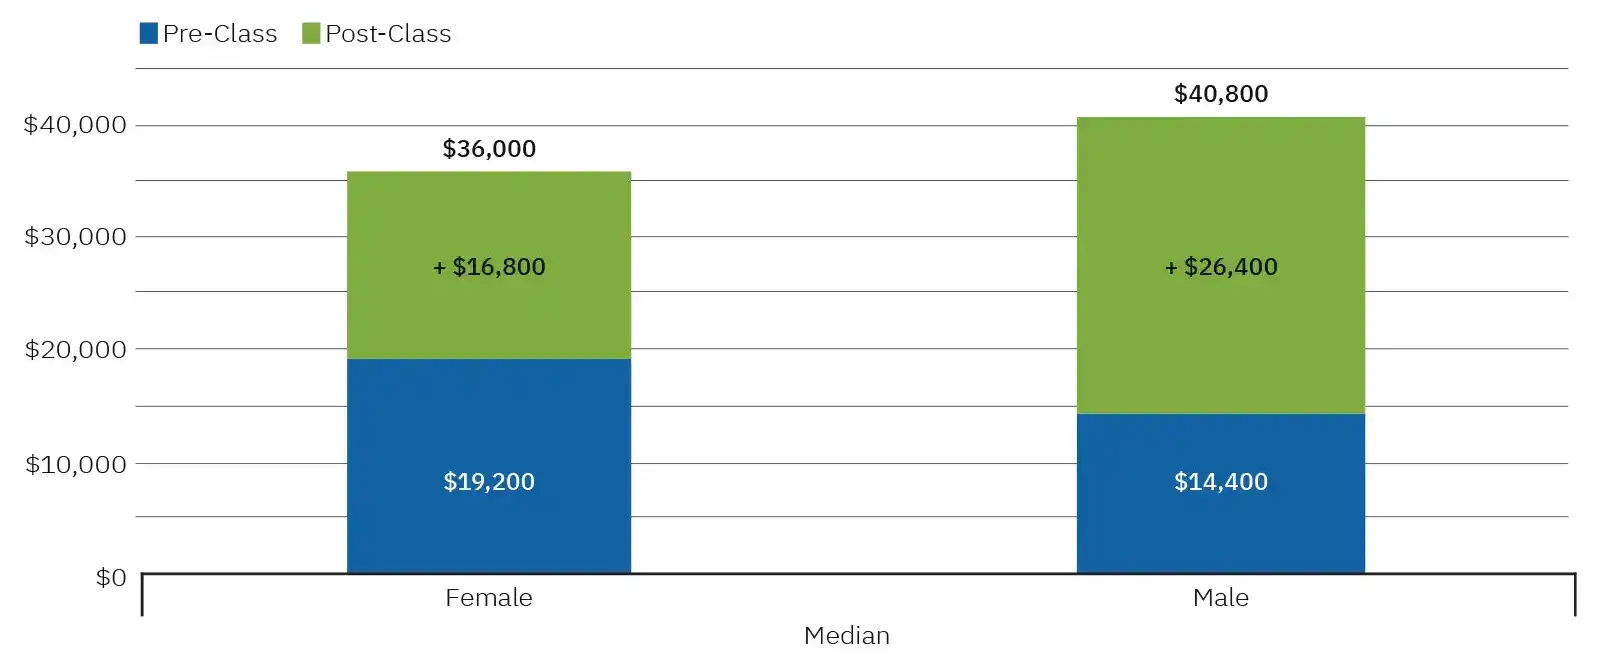
Can Code also collects pre- and post-program salary information from its learners, revealing significant economic outcomes. Overall, Can Code's learners achieve a median pay increase of $23,800 following program completion. However, when disaggregated by gender (figure 8), the data reveals a pay disparity between female and male learners. This finding illustrates the importance of interrogating data beyond surface-level metrics. Organizations noticing disparate outcomes among learners could dig deeper into existing data by asking critical questions about potential demographic differences in the types of courses students enroll in, differences in prior experience, or concentrations in lower-paying industries, job types, or part-time roles rather than full-time roles. By examining data through multiple lenses, programs can identify where targeted interventions might be most effective or cultivate new partnerships that facilitate better outcomes for all students.
Figure 8
Salary Outcomes by Gender
2016-2025, US Dollar, Nominal Salary
Case 4: Listening for impact
In addition to collecting survey data, in 2025 Can Code conducted a qualitative evaluation of its programming by interviewing current and past participants to better understand the program's impact. The Federal Reserve's Worker Perspectives publications illustrate that qualitative data captures nuance that cannot be ascertained from quantitative data alone.10 This method of program evaluation allowed Can Code to identify specific curricular elements that impacted students' journeys. Several participants shared that they were unsuccessful in attempting to upskill by watching self-paced YouTube videos but were successful in persisting with Can Code's live, differentiated instruction. Additionally, the real-world projects students completed in the courses became projects that participants could leverage for future employment opportunities. These course elements helped boost participants' confidence in their ability to succeed, as this participant described: "I didn't think I could get back into tech until this [program]."11
Conducting a series of formal interviews is a time-intensive and sometimes costly process. However, there are alternatives to separate, rigorous qualitative review processes that can also lead to helpful feedback on program elements and participant experiences. By asking simple questions of program participants (for example, "What would make your experience just a little bit better?"), Can Code was able to identify a critical barrier to participant success. In one instance, an instructor was talking with a student after class and found that the participant did not have the proper equipment to effectively complete course assignments. In response, Can Code began offering loaner laptops and hotspots to their students to ensure that access to technology was not a barrier to participation.12 It also spurred Can Code to track this metric, revealing that one third of their learners needed help with access to a laptop, hotspot, or both.
Measuring outcomes, improving success
This case study illustrates one kind of data infrastructure that facilitates program evaluation, but this infrastructure can require significant investment of resources. Can Code's meticulous approach to data collection and analysis didn't happen by accident; it reflects a strategic decision to prioritize evidence-based practice, even when that means dedicating staff time, resources, and organizational attention to evaluation systems. For Can Code, this investment pays dividends: data doesn't just help them understand what's working, it also enables them to continuously refine their programs, identify and address gaps, and demonstrate successes to funders and partners.
Program data serves dual purposes: internally, it guides continuous improvement and resource allocation decisions, while externally, it provides evidence of impact that can be leveraged strategically for fundraising and stakeholder engagement. For organizations ready and able to make this investment, there is a path forward: workforce development programs that embrace comprehensive data practices position themselves not only to improve outcomes for participants, but also to build the systems necessary for long-term organizational success and impact.
Workforce program recommendations based on this case study:
- Systematically gather longitudinal data on both program participants and outcomes. Without comprehensive data collection, organizations cannot truly understand who they are serving, whether they are reaching their intended populations, or what impact their programming is having on participants' lives and careers. Additionally, following participants over months and years enables organizations to assess whether interventions are working and have long-term impact.
- Leverage Unexpected Findings to Drive Continuous Program Improvement. Results that differ from anticipated outcomes can highlight disparities, gaps, or areas of concern and should be leveraged to inform continuous program improvement. Use these findings to guide targeted interventions, refine strategies, and strengthen overall program effectiveness.
- Ask questions that can measure impact. The design of the survey instrument and interview protocols matter. The question phrasing, timing of data collection, mode of administration, and language accessibility all influence the quality, accuracy, attribution, and completeness of the data.
- Ask for feedback, listen for answers. Qualitative data is an invaluable supplement to quantitative data for identifying specific program elements that are most impactful, either positively or negatively, and for digging deeper into granular insights. While formal interviews can be time intensive and costly to collect, simple check-ins can be conducted throughout the participant's journey.
The views expressed here are those of the author and not necessarily those of the Federal Reserve Bank of Atlanta or the Federal Reserve System. Any remaining errors are the author’s responsibility.
The Federal Reserve Bank of Atlanta does not provide grants or funding to the general public or to partner organizations. We do not endorse or make any representations as to the suitability of partner organizations, their products, or their programs, and we do not advise on distribution of funds by partners.
The Federal Reserve Bank of Atlanta's Community and Economic Development function supports the Central Bank's mandate of stable prices and maximum employment by helping improve the economic opportunity of low- and moderate-income (LMI) individuals and underserved places for a stronger economy for all Americans. Community development is one of the Federal Reserve's core functions and this responsibility is rooted in its mandates from Congress. Partners Update articles address community and economic development trends, issues, and events. Find more research, use data tools, and sign up for email updates at Community Economic and Development.
- 1 Can Code Communities, "About Can Code Communities" (Can Code Communities, 2026).
- 2 Mary Kay Gugerty and Dean Karlan, The Goldilocks Challenge: Right Fit Evidence for the Social Sector (Oxford University Press, 2018).
- 3 Amanda Bergson-Shilcock, Roderick Taylor, and Nyerere Hodge, "Closing the Digital Skill Divide: The Payoff for Workers, Business, and the Economy" (National Skills Coalition and Federal Reserve Bank of Atlanta, 2023).
- 4 See Paul Mohnen and David Lee, "Recent Trends in the Demand for AI Skills" (Federal Reserve Bank of Atlanta, 2024); Sergio Galeano, Nyerere Hodge, and Alexander Ruder, "By Degree(s): Measuring Employer Demand for AI Skills by Educational Requirements" (Federal Reserve Bank of Atlanta, 2025); Salome Baslandze, Zach Edwards, and John Graham, et al., "Artificial Intelligence, Productivity, and the Workforce: Evidence from Corporate Executives" (Federal Reserve Bank of Atlanta, 2026); and Sergio Galeano, "The Geography of AI Demand in the Southeast: Patterns of Growth and Labor Market Structure" (Federal Reserve Bank of Atlanta, 2026).
- 5 Amanda Bergson-Shilcock, Roderick Taylor, and Nyerere Hodge, "Closing the Digital Skill Divide: The Payoff for Workers, Business, and the Economy" (National Skills Coalition and Federal Reserve Bank of Atlanta, 2023).
- 6 Sarah Miller, Merissa Piazza, Elizabeth Simpson, and Kristen Broady, "When every dollar counts: Inside the economic struggles of workers who earn low to moderate incomes" (Fed Communities, 2026).
- 7 See Can Code Communities.
- 8 Can Code Communities, "About Can Code Communities" (Can Code Communities, 2026).
- 9 "Percentage of women workers in science, technology, engineering, and math (STEM)" (Women's Bureau of the US Department of Labor, 2026).
- 10 Sarah Miller, Merissa Piazza, Elizabeth Simpson, and Kristen Broady, "When every dollar counts: Inside the economic struggles of workers who earn low to moderate incomes."
- 11 Blake Noel, workforce development consultant, email correspondence with authors, January 27, 2026.
- 12 Annmarie Lanesey, Founder and CEO of Can Code Communities, video conference communications with authors, 2025.