Real gross domestic product (GDP) declined at an annualized rate of 4.8 percent in the first quarter, according to the first estimate from the U.S. Bureau of Economic Analysis (BEA), 3.8 percentage points more than the decline anticipated by the Atlanta Fed's final GDPNow model projection. Why was the error, which was easily the model's largest on record for final GDPNow forecasts, so big? Chart 1 looks at GDPNow's forecast errors since the model went live in mid-2014 and breaks them down into forecast errors for the various subcomponents' contributions to GDP growth.
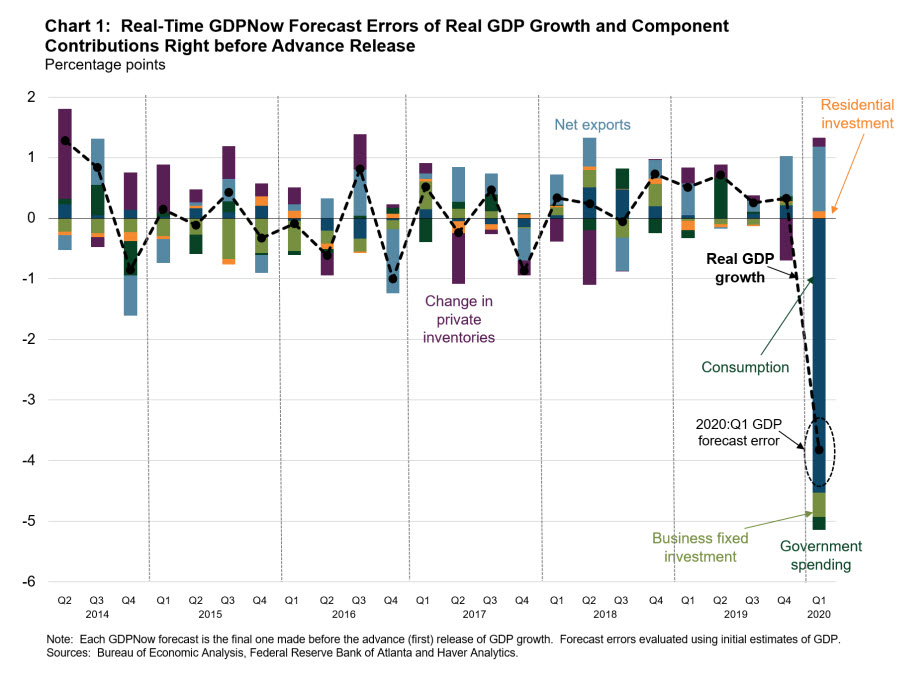
The clear culprit is the fact that the GDPNow model did not anticipate the record 9.5 percent monthly decline (not annualized) in real services consumption in March. At that time, GDPNow had March services data available only for electricity and natural gas use and purchased meals and beverages, as well as revised February data for net foreign travel. If the model would have correctly forecasted the March growth rate in services consumption for the subcomponents besides these, it would have actually slightly overstated the first-quarter decline in real consumer spending. (I should note that because of the timing and impact of last quarter's social distancing efforts stemming from COVID-19, the BEA used data outside of the scope of its routine procedures to estimate part of services spending in March—in particular, data about private credit card transactions for health care and recreation services.)
By design, GDPNow is a purely model-based prediction method as opposed to the models of some private forecasters, who were able to incorporate developments related to COVID-19 into their April forecasts for first-quarter GDP growth in a way that GDPNow did not and could not. As a result, their GDP predictions turned out to be relatively more accurate. For example, the consensus forecast of first-quarter GDP from the Wall Street Journal Economic Forecasting Survey in the first full week of April was a decline of 3.3 percent, and the CNBC Rapid Update survey late in the week prior to the GDP release anticipated a decline in GDP of 5.3 percent. Private forecasts will continue to be able to use news developments and high-frequency or nonstandard data sources (such as initial unemployment claims and OpenTable restaurant dining data) in a way that GDPNow and similar nowcasting models do not. The New York Fed's recently introduced Weekly Economic Index combines a set of weekly indicators into a single index with units comparable to four-quarter GDP growth, but it does not actually nowcast quarterly GDP growth.
Around the time of recessions, macroeconomic projections from professional forecasters tend to be less accurate and show more dispersion than during nonrecessionary periods. And though the National Bureau of Economic Research has not identified a 2020 business cycle peak, recent GDP forecasts show much more dispersion than they did during, or close to, past recessions. Chart 2 shows the difference between the top 10 and bottom 10 average forecasts of real GDP growth (for both the current quarter and one quarter ahead) in the Blue Chip Economics Indicators survey administered in the middle month of each quarter since 1991.
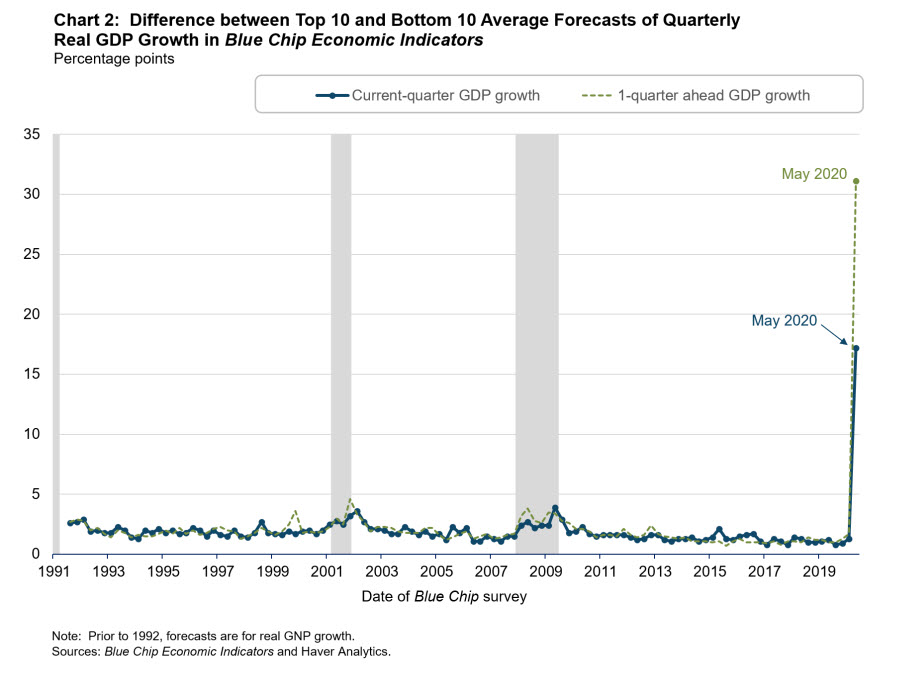
The top 10/bottom 10 difference for current-quarter GDP forecasts in the May 2020 survey is clearly much larger than around past recessions. In fact, it's larger than the difference between the highest and lowest quarterly growth rate of GDP after 1983, around the time economists date the onset of the Great Moderation—in reference to the decline in macroeconomic volatility—in the mid-1980s. Prior to the May 8 employment release, GDPNow was more optimistic about second-quarter GDP growth than most private forecasters were, but after the model forecast was revised down from a decline of 17.6 percent to a decline of 34.9 percent on the heels of that report, it fell more in line with the others.
The dispersion in the forecasts for GDP in the third quarter of 2020 is even starker. The optimistic forecasters project 2020:Q3 growth to be well above the highest rate on record (15.7 percent in 1950:Q1), and the pessimistic forecasters project contracting GDP. Of course, we will not be able to determine how accurate forecasts of second- and third-quarter GDP growth are until later in the year. Nevertheless, the wide range of forecasts implies that at least some forecasters' GDP projections will be wildly off by historical standards. As St. Louis Fed economist Michael McCracken recently noted, what the late Yankees catcher Yogi Berra said is more true than ever: "It's tough to make predictions, especially about the future." Berra's wisdom also will also apply to producing accurate and reliable economic forecasts for some time to come.
 By Pat Higgins, a policy adviser and economist in the Atlanta Fed's research department