GDP-Based Recession Indicator Index
February 01, 2017
James D. Hamilton*
The GDP-based recession indicator index had been slightly elevated as a result of weak GDP reports in the first half. With the 3.5 percent growth rate in the third quarter and 1.9 percent in the advance 2016:Q4 report, the index is now back down to 5.3 percent. The U.S. economy clearly remains in the expansion phase. A paper by Marcelle Chauvet and James Hamilton (from Nonlinear Time Series Analysis of Business Cycles, 2006, edited by Costas Milas, Philip Rothman, and Dick van Dijk) concluded that the United States could be said to have entered a recession when the index rises above 67 percent.
GDP-Based Recession Indicator Index
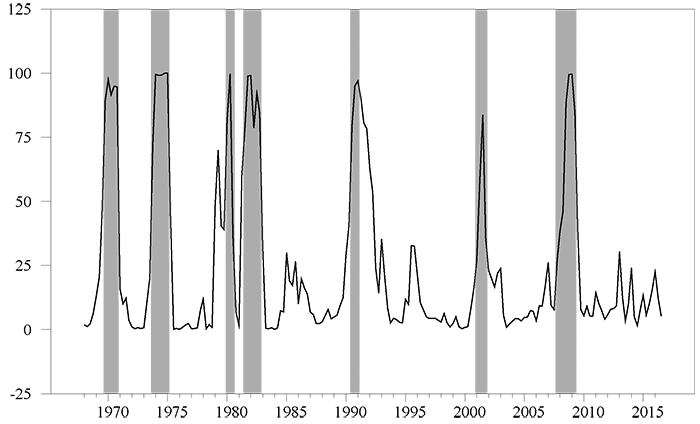
The index is a pattern-recognition algorithm that assigns dates to when recessions begin and end based on the observed dynamics of U.S. real GDP growth. To make a reliable inference, it is necessary to wait one quarter for data to be revised and confirm the current trend. Thus with the 2016:Q4 advance GDP numbers released by the Bureau of Economic Analysis on January 27, 2017, a value of the recession indicator index describing economic conditions for the fourth quarter of 2016 can be calculated. To maximize usefulness as a real-time indicator, the index is not subsequently revised. The index ranges from 0 to 100, with a value above 50 indicating the data are more consistent with a recession than expansion.
Based on the recession indicator index, the Great Recession was determined to have begun in 2007:Q4 and ended in 2009:Q2. These start and end dates for the recession are the same as were announced separately by the Business Cycle Dating Committee of the National Bureau of Economic Research, though NBER did not issue its end-date declaration until September of 2010. The current reading of the index indicates that the expansion is still continuing.
For more details about the method, see Chauvet and Hamilton's paper.
*James Hamilton is a professor of economics at the University of California, San Diego.