What is the Sticky-Price Consumer Price Index (CPI)? How the Atlanta Fed Data Tool Tracks Underlying Inflation

1. What is the Sticky-Price CPI tool?
2. What is the CPI?
3. What is price stickiness?
4. Which components of the CPI are sticky?
5. How does CPI relate to inflation?
6. Why is the Sticky-Price CPI tool useful?
7. How do you interpret the Sticky-Price CPI tool?
8. Where can I find sticky-price CPI and learn more about the data tool?
What is the Sticky-Price CPI tool?
The Atlanta Fed’s Sticky-Price CPI data tool informs users about inflation dynamics using goods whose price changes are slower to adjust. It categorizes CPI components into sticky or flexible items based on how frequently prices change. New data updates are published on the day of the latest CPI release, which typically occurs monthly.
What is the CPI?
The CPI measures the average change in prices of a fixed basket of goods and services purchased by urban households over time. In constructing the CPI, the Bureau of Labor Statistics collects prices across 75 urban areas in the US and from more than 20,000 retail and service businesses.
The CPI is often used as an economic indicator, allowing economists to study inflation and cost of living. It also serves as a means for adjusting dollar values and as a price deflator to translate nominal series into real or inflation-adjusted series.
What is price stickiness?
If the price of a particular good or service is sticky, it’s fixed for a given period of time, months or maybe even years. Hence, these prices adjust slowly to changing economic conditions. Many economists believe that these prices, in part, reflect the expectations of those sellers who anticipate changes in overall inflation over the period of time the prices of their products or services remain fixed.
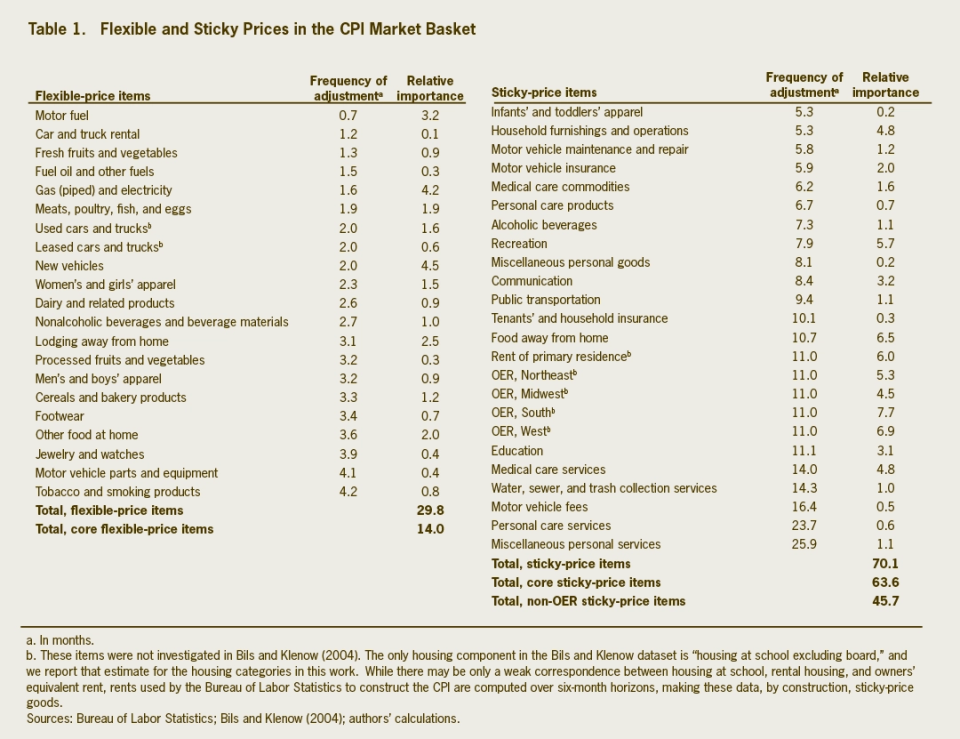
Which components of the CPI are sticky?
We classify whether a component in the CPI is flexible or sticky based on academic research measuring the frequency of price change for a particular good or service. For example, gasoline prices change very frequently, sometimes daily. On the other hand, insurance prices change very infrequently, typically about once a year. Below is a table excerpted from a 2010 Economic Commentary by Michael F. Bryan and Brent H. Meyer detailing the properties of flexible-price and sticky-price CPIs.
How does CPI relate to inflation?
CPI is a statistic that measures changes in the cost of living over time and across different locations within the US. It is often used to measure inflation over longer periods of time. Inflation is the decline in the purchasing power of money and is seen through the general rise in the prices of goods and services. Economists pay attention to other price-change statistics like the core CPI (which excludes the more volatile food and energy prices) and trimmed-mean inflation to gauge the growth rate of underlying inflation and to forecast future inflation.
Why is the Sticky-Price CPI tool useful?
Sticky-price CPI is a new class of underlying inflation statistics that focuses on slow-to-adjust prices and changing economic conditions. The statistics are thought to have a component of embedded inflation expectations. Research has shown that the sticky-price CPI better predicts the future of inflation over longer time horizons (ideally more than 2 years) than the core CPI.
How do you interpret the Sticky-Price CPI tool?
You can interact with a Sticky-Price CPI tool graph and filter between Sticky CPI, Core Sticky CPI, Flexible CPI, and Core Flexible CPI.
For each type of CPI, toggle between lengths of tracked time as well. The graph plots the CPI percentage by year.
Where can I find sticky-price CPI and learn more about the data tool?
You can learn more about sticky-price CPI and explore the data and graphs on the Atlanta Fed’s website or with the EconomyNow app.