New Fed Data: Number and Value of Payments for Largest DIs 2015 to 2022
April 07, 2026

The Federal Reserve Payments Study has released new data detailing the annual payments activity of the largest depository institutions (Top 100 DIs) in the US from 2015 through 2022. This is the first time that aggregate volumes for the Top 100 DIs (comprising 85 commercial banks, five savings institutions, and 10 credit unions) have been published, making this dataset a unique look into how customers of the largest DIs in the banking system move money.
Covering a time when payments changed rapidly, the eight-year period includes the disruption of the COVID-19 pandemic. The number and value of three major clearing and settlement systems in the United States are included: check, automated clearing house (ACH), and wire.
For the Top 100 DIs from 2015 to 2022:
- ACH transfers grew fastest by value
- In 2022, wire transfers constituted most payments by value
- Wire transfers grew fastest by number
- In 2022, ACH debits constituted most payments by number
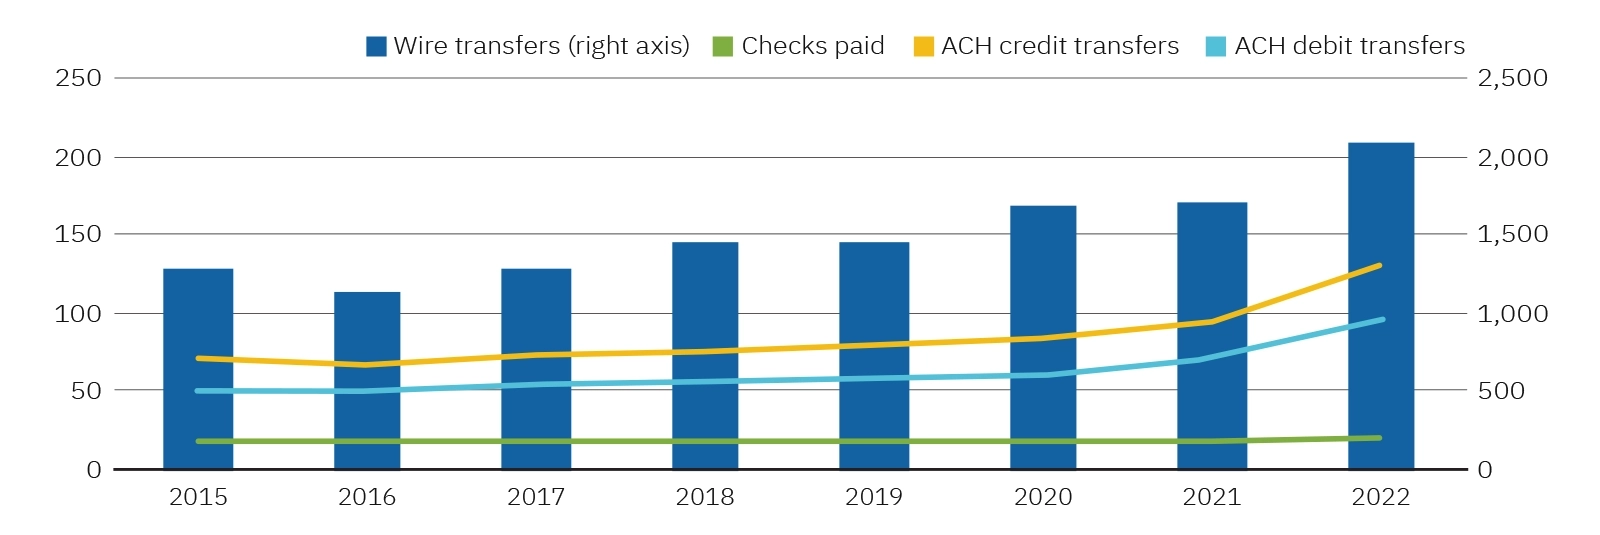
ACH transfers grew fastest by value
From 2015 to 2022, the value of ACH debit transfers increased 9.3 percent per year, ACH credits increased 9.0 percent per year, and wire transfers 7.2 percent per year. Even the value of check payments increased 1.6 percent each year.
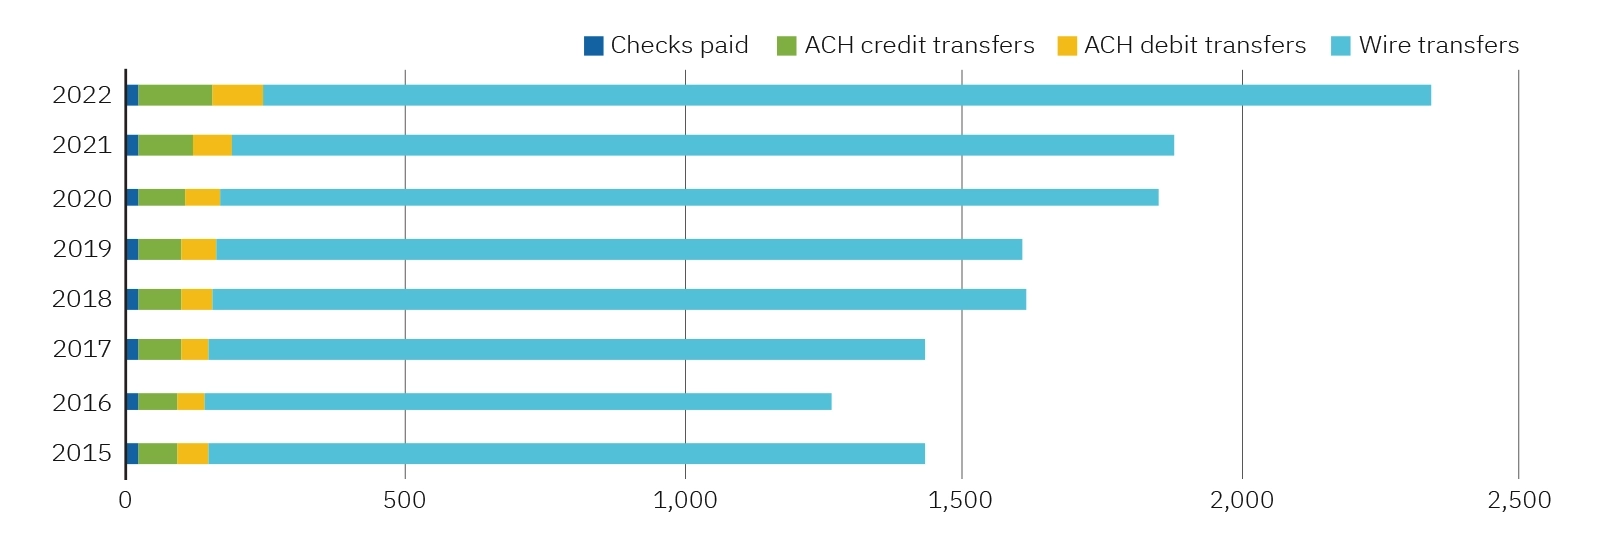
In 2022, wire transfers constituted most payments by value
The wire transfer systems—the Clearing House Interbank Payments System (CHIPS) and Fedwire, operated by the Federal Reserve Banks—mostly handle monetary settlement transfers between financial institutions and large-value payments by businesses. That’s why, by value, wire transfers dominate ACH and check payments at Top 100 banks.
At Top 100 DIs in 2022, wires accounted for 90 percent of the sum of wire, ACH, and check payments by value. ACH credit transfers were 6 percent, ACH debits, 4 percent, and checks, 1 percent (with rounding).
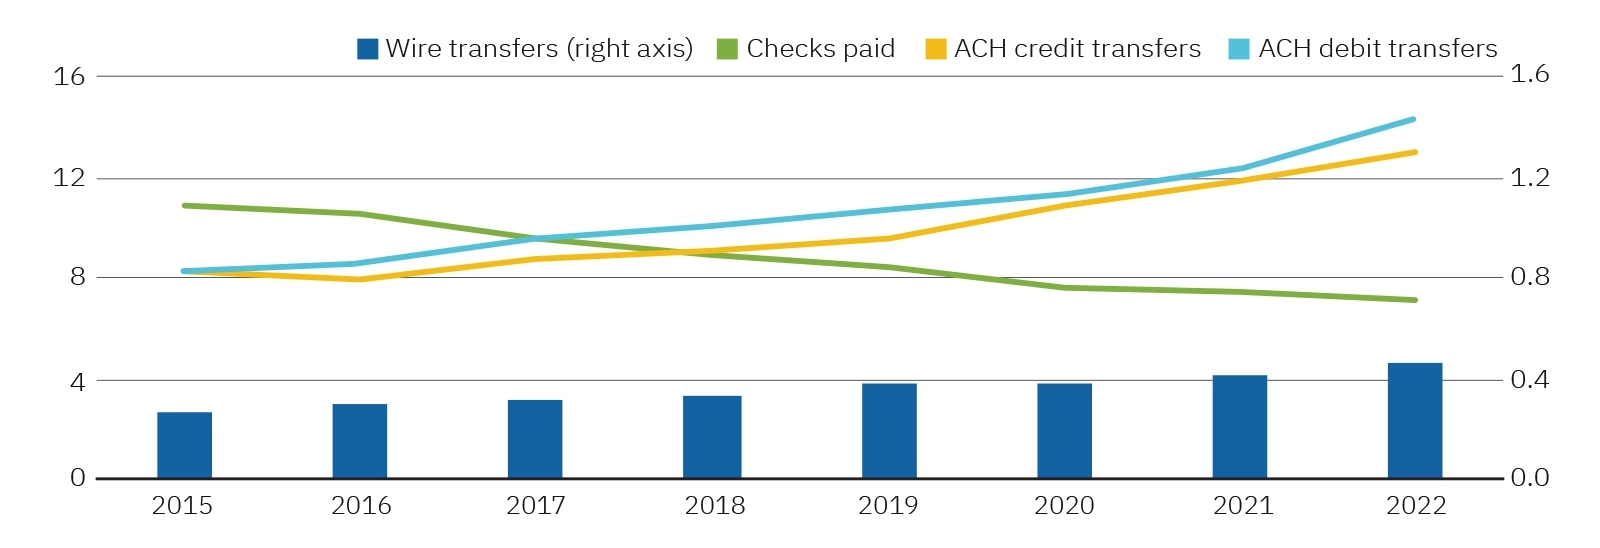
Wire transfers grew fastest by number
From 2015 to 2022, the number of wire transfers originated increased 8.8 percent per year, ACH debits increased 8.0 percent and ACH credits, 6.6 percent. Checks paid declined 5.9 percent per year over the period.
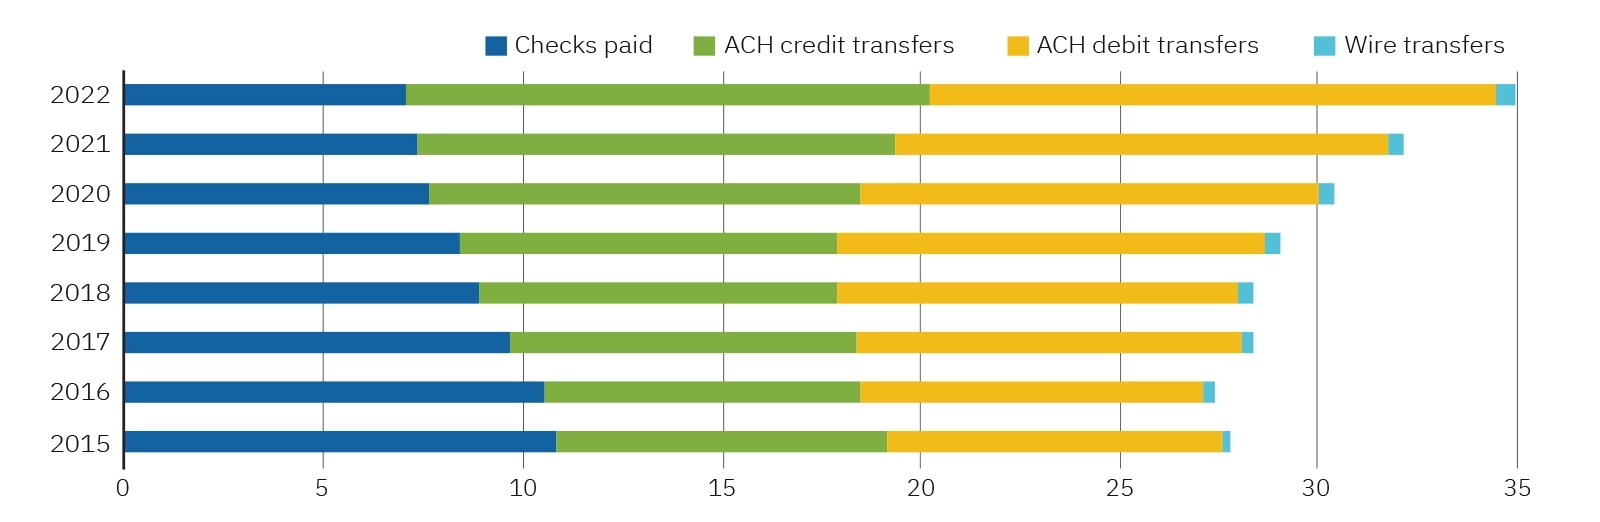
In 2022, ACH constituted almost 80 percent of payments by number
At Top 100 DIs in 2022, ACH transfers accounted for 78 percent of payments. ACH debit transfers were 41 percent by number, ACH credits, 38 percent, checks, 20 percent, and wires, 1 percent.
You can see and download this data and the accompanying "Notes on the Top 100 Data, DFIPS (CY 2015–2022)" at Federal Reserve Board Federal Reserve Payments Study (FRPS).
The release also includes alternative payments initiated via bank web sites or apps (bank bill pay and person-to-person [P2P]). In addition, for triennial years when nationally representative samples are available (2015, 2018, and 2021), the release provides breakouts of aggregate total volumes with the volumes attributed to the largest DIs and all other DIs.