New Fed Data: Differences in Payments Activity at Large and Smaller Institutions
May 12, 2026


In my last post, I described some findings of the Federal Reserve Payments Study (FRPS) that show how customer mix is different at the 100 largest and all other depository institutions (DIs) in the US. Today, let's look at how that customer mix drives differences in payments activity at the largest and smaller DIs.
This commentary is based on new data released by the FRPS in March, detailing payments activity by the 100 largest DIs by transaction account deposit size. The release provides the number and value of check, ACH, wire, and alternative payments (bank bill pay and person-to-person) at the 100 largest DIs and all other DIs for 2015, 2018, and 2021.
Supplemental data collected annually for the Top 100 DIs makes it possible to refine the estimates of payments activity for the large institutions by enabling comparisons of submitted data from one year to the next. Increasing the amount of data collected for this group helps make estimates for the largest DIs—and by extension the national estimates—more precise. (Only aggregate data is reported. Individual data submissions are strictly confidential.)
As noted in the previous post, average business transaction account balances at the Top 100 DIs by deposit size imply that these DIs serve the largest businesses in the US. This flows through to payments. For business payment types, the annual number of payments per account were markedly higher at top DIs in 2021 (see table 1), the most recent year for which survey data was reported for institutions by deposit size.
Table 1: Average number of business payments per account in 2021
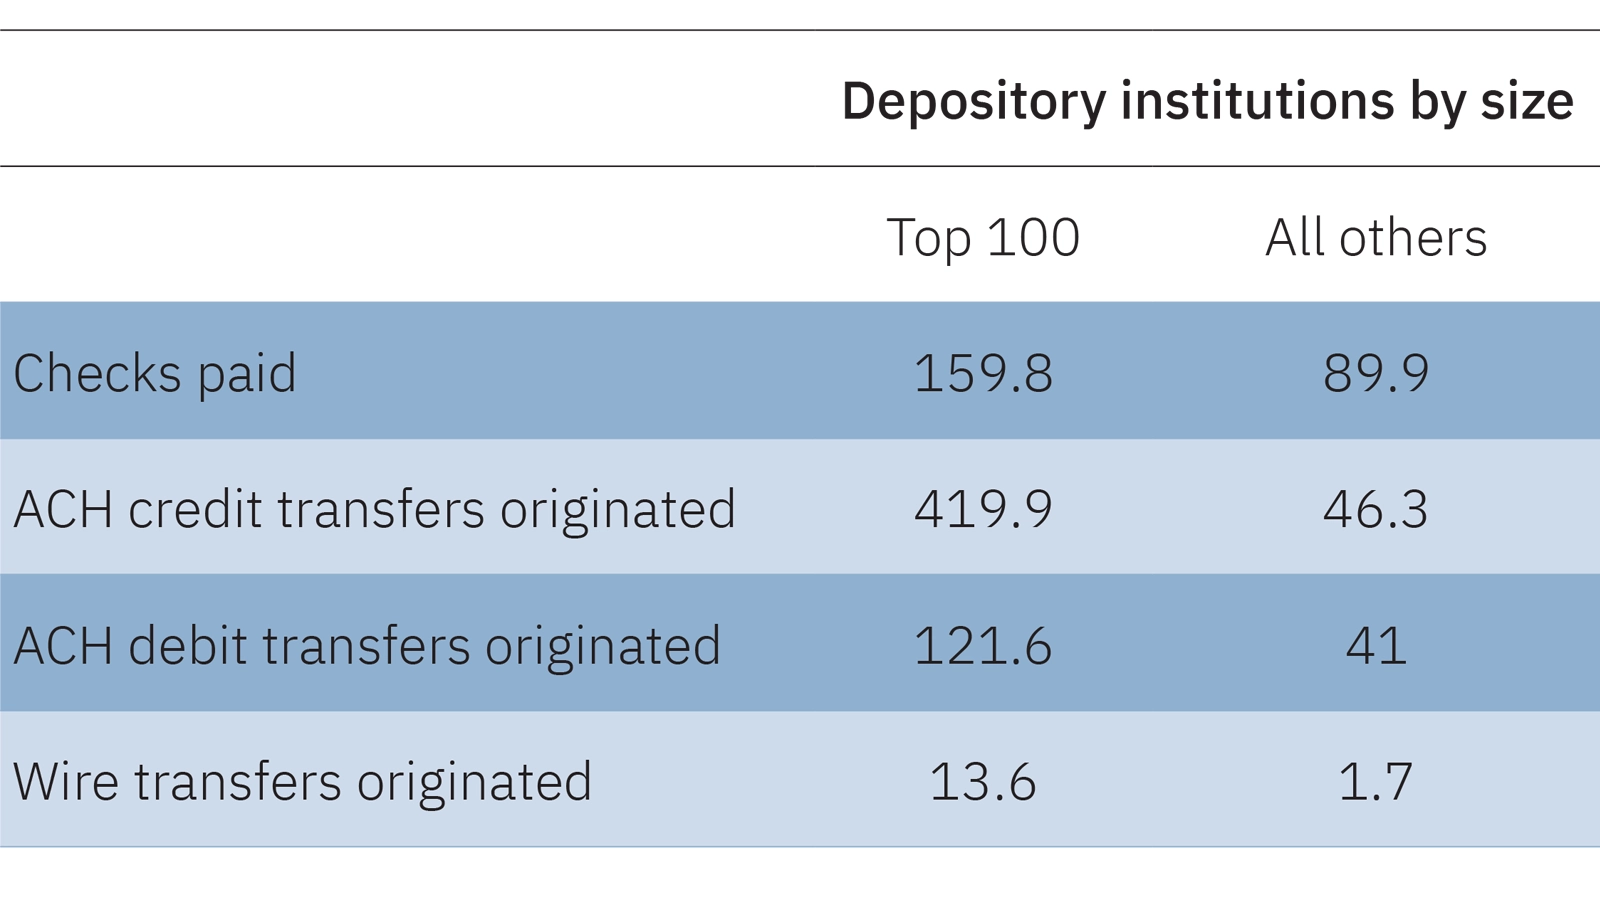
Especially after considering the likelihood that very large businesses have multiple payment accounts, the differences in the number of payments per account were pronounced. There were about nine times as many ACH credit transfers that originated from a business account at Top 100 DIs as transfers initiated at all other DIs. Similarly, eight wire transfers originated from a Top 100 DI for every transfer from all other DIs.
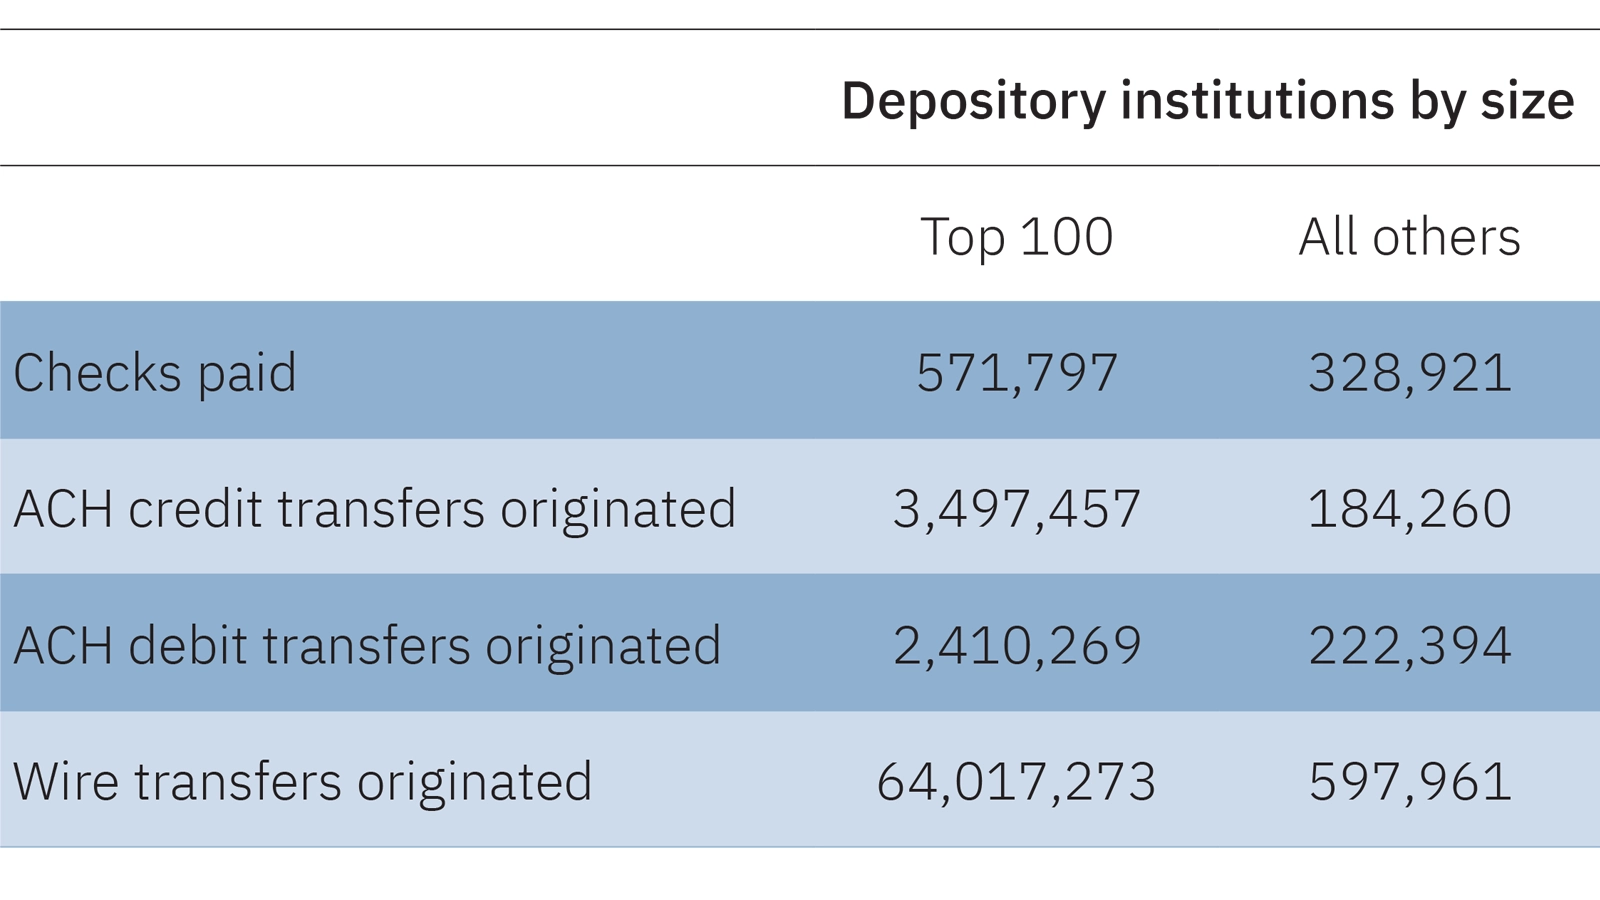
Differences in the value of business payments per account are equally significant. As shown in table 2, the average value of wire transfers originating from Top 100 DI business accounts exceeded wires from all other DIs by more than 100 times. Perhaps reflecting smaller businesses' greater reliance on checks, the average value of checks paid from business accounts at Top 100 DIs in 2021 was less than twice that of the average value at all other DIs.
Table 2: Average value of business payments per account in 2021 ($)
The release includes 10 Excel worksheets comprising Total, Top 100, and All Other estimates for 2015, 2018, and 2021, as well as annual estimates encompassing 2015 through 2022 for the Top 100 DIs. You can download data at Federal Reserve Board - Federal Reserve Payments Study.