What Enrollment Numbers Can (and Cannot) Tell Us About Access to Postsecondary Training Programs
April 08, 2026


Workforce Currents 2026-02
Digital Object Identifier: https://doi.org/10.29338/wc2026-02
While there has been some debate over the value of college, workers and employers still perceive credentials as important for employability. 1 Postsecondary education, or "formal learning opportunities beyond high school,"2 is linked to greater labor force participation, higher employment rates, and increased individual economic success.3 Access to postsecondary training, however, remains an issue.
To better understand postsecondary access, in this Workforce Currents we analyze available enrollment data from the National Center for Education Statistics' (NCES) Integrated Postsecondary Education Data System (IPEDS). Enrollment data is one way to examine learners' access to various institutions. We review enrollment demographics of US postsecondary institutions of varying types, including two-year public (or community college) and not-for-profit private and public four-year, to better understand enrollment demographics.4 These institutional types represent roughly half of IPEDS' undergraduate enrollments. We also analyzed novel data from SkillUp Coalition, a nonprofit that serves as a career navigation platform for job training and career opportunities, that provides an illustration of specific learner subsets interested in or enrolled in non-degree postsecondary programs. 5
Key takeaways
- A larger share of learners at public two-year institutions or community colleges are low income, non-white, and older (over age 25) than learners at four-year postsecondary institutions.
- Almost three in four individuals in the SkillUp sample enrolled in non-degree programs earn less than $40,000 per year and are non-white. More than four in five are over the age of 25.
- The lack of publicly available, reliable data specifically on non-degree program demographics, enrollment, and outcomes leaves a gap in our understanding of the postsecondary landscape, including the return on investment for learners.
Background
Postsecondary education is one pathway to improve individual economic opportunity and prosperity. The financial returns of a college degree are strong, with increasing lifetime income two to three times over that of a high school diploma. However, not everyone has access to these growth opportunities. Learners with lower incomes are less likely to enroll in postsecondary education compared to their counterparts with higher incomes.7 Access, attainment, and outcomes often vary by income, along with other demographic characteristics such as age, race, and ethnicity.8
Choice of educational program also impacts individual outcomes. According to Credential Engine, there are over 1.85 million credentialing programs offered in the United States.9 The marketplace is vast, but recent data tells us that community colleges are the fastest growing postsecondary institutions, driving overall growth in undergraduate postsecondary enrollment over the last year with certificates and associate degree programs outpacing bachelor's degrees.10 Learners enrolled in postsecondary education appear to be earning non-degree certificates more than ever before. 11
Non-degree credentials include for-credit and non-credit programs that may offer a certificate, diploma, or apprenticeship pathway but do not culminate in a degree.12 Non-degree credentials are often more flexible, take less time to complete, and require less financial investment. Furthermore, these programs may have closer alignment to specific workforce needs than other program types. This can be a more attractive option than traditionally structured degree offerings, especially for learners with more limited financial resources to invest in their education.
Non-credit programs, such as Commercial Driver's License (CDL) and welding, are also often shorter in duration than other programs and focused on workforce preparation so learners can easily enter the labor market or receive assistance in career advancement. Historically, data for non-credit programs has been scarce and largely unavailable publicly, making enrollment difficult to track. One reason is because non-credit programs have not been funded federally and therefore do not have the same reporting requirements as credit-bearing programs. Nevertheless, recent data from the Federal Reserve Bank of Richmond finds that significant enrollment at community colleges is concentrated in non-credit programs.13 Because some states have decided to fund non-credit programs, there is some research on these programs focused on the state level.14 In Maryland, for example, non-credit programs account for almost a fourth of community college enrollment.15 Findings on non-credit programs in Virginia and Texas16, for example, indicate these programs tend to enroll more non-white, male learners than credit bearing programs.
The recent expansion of Pell Grants (need-based financial aid) to include shorter-term, non-credit programs in federal financial aid may create stronger public data moving forward, but at present it is difficult to paint a complete picture of the national landscape.17 Currently available data does not capture workforce training that happens outside the walls of institutions of higher education. IPEDS, for example, does not capture enrollment in certificate programs or other types of non-degree credentials. This is a significant gap in postsecondary data that makes it difficult to accurately assess access via program enrollment and, ultimately, difficult to understand program impact for either learners or institutions.
Despite the challenges facing researchers, new data derived from the Atlanta Fed's partnership with SkillUp Coalition enables us to explore public data and survey data to better understand the learners who are accessing postsecondary programs. Identifying the enrollment patterns of these learners, in turn, allows us a baseline going forward to assess completion rates and outcomes, particularly return on investment.
Which institutions serve which learners?
Using the IPEDS data, when we compare first-time, full-time enrollment in two-year or community college institutions against public and not-for-profit private four-year institutions, we see that community colleges have the highest share of Pell Grant recipients or low-income learners, about 46 percent. Community college learners also tend to be older and are more likely to be people of color than other institutional types examined (figure 1). Overall, half of all undergraduate students attend community colleges. This is unsurprising given these institutions are also often considered critical to supporting non-traditional student access to success in postsecondary education.18
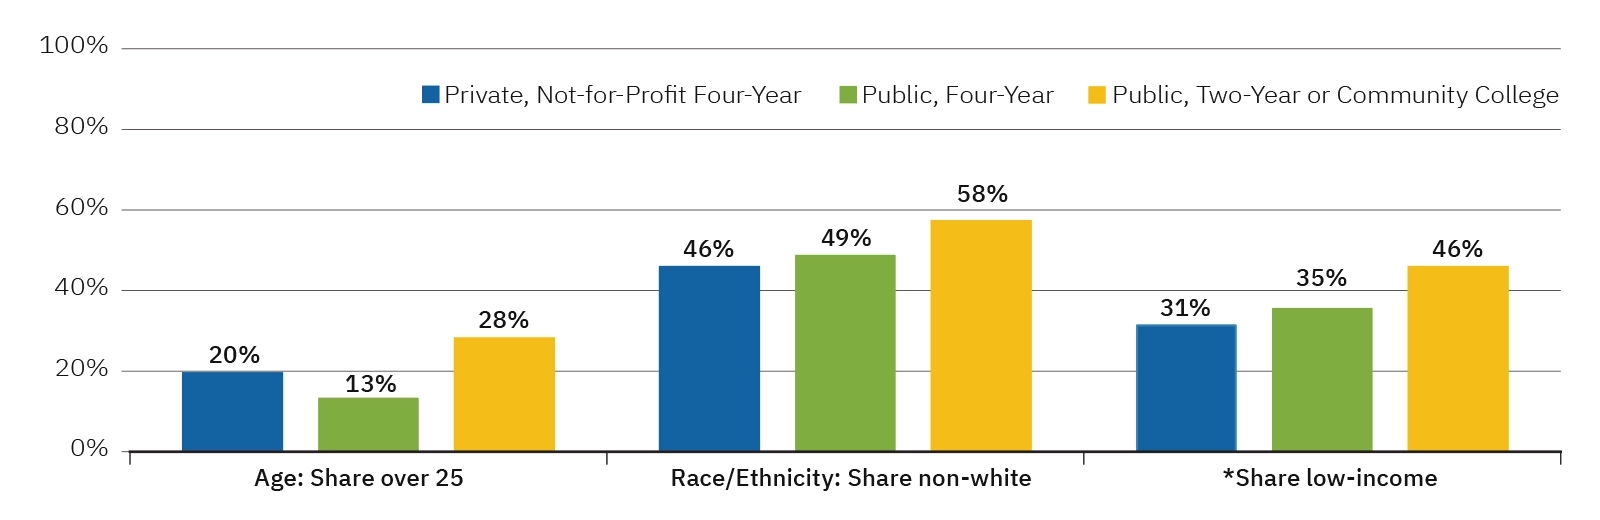
*The low-income proxy for public and private educational institutions is Pell Grant recipient.
SkillUp users and the learners are less likely to be first-time students or enrolled full-time, so they cannot be directly compared with IPEDS data. However, novel survey data collected by SkillUp Coalition can provide distinctive insight on the potential enrollment makeup of workforce training and skill development inside and outside of the postsecondary education landscape, specifically non-degree options. SkillUp's platform connects users with over 7,000 training programs, over 60 percent of which are offered through community colleges and roughly 25 percent of which are offered by short-term training providers.
In 2024, about 28 percent or 1,288 SkillUp users of all survey respondents reported that they were currently enrolled in a non-degree job training program. Compared to the SkillUp population enrolled in degree programs, those enrolled in non-degree programs through SkillUp are more likely to be nonwhite and low income (figure 2). 19
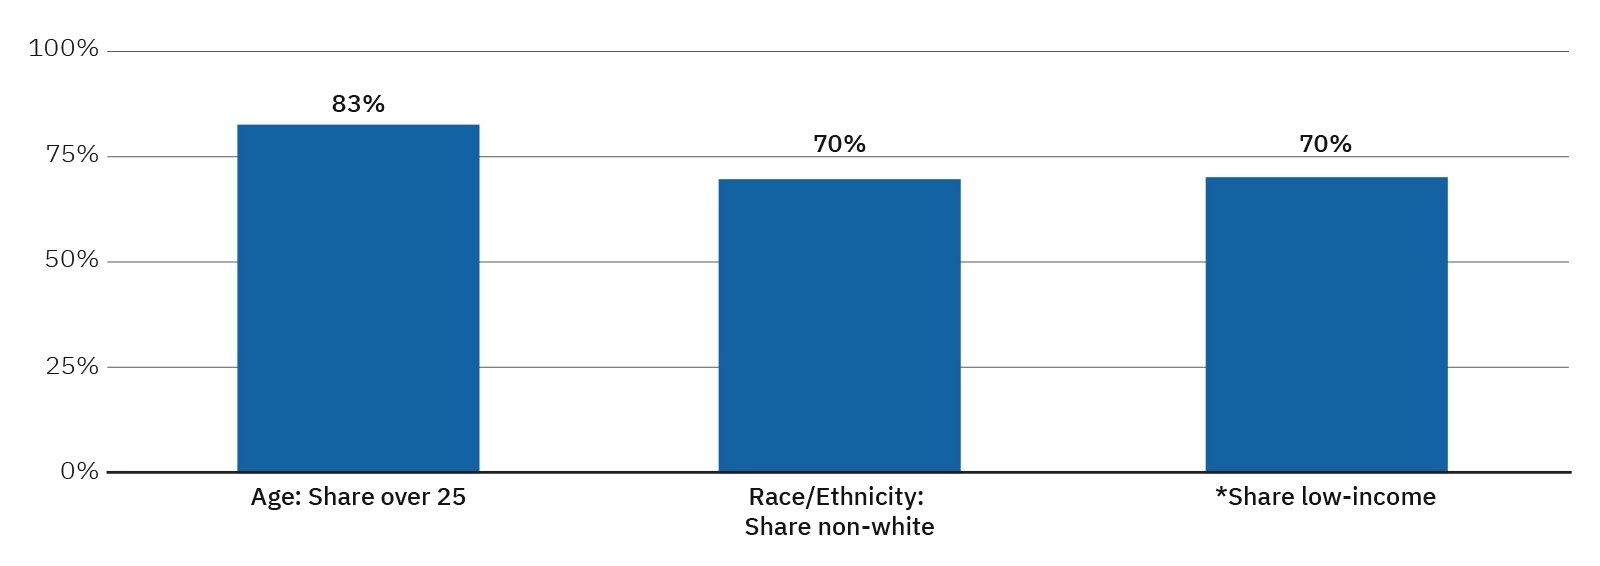
*The low-income proxy used for SkillUp is individuals earning less than $40,000 annually.
Conclusion
Learners with lower incomes and strained financial resources are more likely to pursue non-degree pathways like certificates.20 Most learners pay out-of-pocket for these non-degree credentials,21 making it critical for them to understand and invest in quality programs that yield positive economic outcomes.22 With limited available data on non-degree programs—in IPEDS or elsewhere—there is a question of how to effectively capture and understand the full scope of postsecondary enrollment. An unclear picture, particularly for non-degree programs, makes it difficult to measure the value of these programs or the return on investment for a significant portion of learners.23
On the micro level, the lack of data means prospective learners do not have all the information needed to make informed decisions about the wide range of credentials available to them. This can make credentials, degree or otherwise, an uncertain investment for learners. Without some assurance of benefit to or advancement in their employment prospects, many learners choose to stay on the sidelines instead of pursuing educational opportunity.24 From a macro perspective, missing data leaves education and workforce systems unable to identify gaps in access and services. As a result, practitioners, researchers, and policymakers are poorly positioned to facilitate improvements that could yield better outcomes.
Access to and enrollment in postsecondary education is only part of a larger picture for learners' economic mobility. Learners must also complete the coursework or earn the credentials and transition into the labor market to then potentially realize the benefits or return on their education. But learners often face a variety of obstacles along their educational path. So, beyond access and enrollment, future analyses could explore whether and how these obstacles differ for learners and thereby gain a better understanding of associated labor or economic outcomes. We also could examine the overlapping roles of institutions, communities, and government in supporting learners toward those outcomes. Lastly, incomplete or insufficient data on non-degree programs may be a symptom of misaligned education and workforce systems. Research could surface opportunities to better understand and optimize the value of all types of postsecondary education to individuals and the economy.
Data Limitations
IPEDS serves as a reliable data resource for understanding costs, financial aid, enrollment, and graduation rates. However, institutions do not report learner income and IPEDS' Pell Grant recipient variable is often used among researchers as an imperfect proxy to capture the share of low-income learners at an institution.25 The Pell Grant is part of the Federal Student Aid program, offering financial assistance for undergraduate postsecondary education.26 The majority of Pell Grant funds (roughly 75 percent) are awarded to learners from families earning less than $40,000 annually.27 Learners cannot earn a Pell grant for more than twelve terms (about six years). Learners are not eligible if they have already earned a bachelor's degree, and they must stay in good academic standing. These parameters suggest not all learners are recipients of Pell Grants and thus are not fully represented in IPEDS data. This, in turn, indicates an overall underestimation of low-income learners enrolled in postsecondary education.
The SkillUp data, unlike IPEDS, includes income information, allowing us to reference data on low-income individuals interested in postsecondary education and their enrollment patterns. About 80 percent of the SkillUp sample earns less than $40,000 annually. For more information on the SkillUp data see Appendix B.
Appendix A: NCES IPEDS Methodology
To understand the landscape of traditional postsecondary institutions, we leverage data from the National Center for Education Statistics' (NCES) Integrated Postsecondary Education Data System (IPEDS), specifically fall enrollment for the 2023-2024 academic year. We pulled data for all Public, Four-Year; Private, Four-Year; and Public Two-Year institutions nationally. Institutions with a majority of two-year associates programs but one or more baccalaureate programs, they are classified as four-year institutions in IPEDS. Therefore, we refine our sample by redefining institutions from Public, Four-year to Public, Two-Year (or community colleges) by using their Carnegie Classification. If a Public, Four-Year institution was classified as any of the following, they were identified in our study as a Public, Two-Year institution:
- Associate's Colleges: High Career & Technical-High Nontraditional
- Associate's Colleges: High Career & Technical-High Traditional
- Associate's Colleges: High Career & Technical-Mixed Traditional/Nontraditional
- Associate's Colleges: High Transfer-High Nontraditional
- Associate's Colleges: High Transfer-High Traditional
- Associate's Colleges: High Transfer-Mixed Traditional/Nontraditional
- Associate's Colleges: Mixed Transfer/Career & Technical-High Nontraditional
- Associate's Colleges: Mixed Transfer/Career & Technical-High Traditional
- Associate's Colleges: Mixed Transfer/Career & Technical-Mixed Traditional/Nontraditional
- Baccalaureate/Associate's Colleges: Associate's Dominant
- Special Focus Two-Year: Health Professions
- Special Focus Two-Year: Technical Professions
We further refined this approach by also assigning any Public, Four-Year institution as a Public, Two-Year institution if they awarded more associates degrees than bachelor's degrees for the 2023-2024 academic year. We also refine the sample of Private, Four-Year institutions by dropping all institutions that awarded more associate's degrees than bachelor's degrees and any institution that, according to the Carnegie Classification, is: "Special Focus Four-Year: Faith-Related Institutions." Those Special Focus institutions were omitted due to their distinct institutional missions, which fall outside the scope of this analysis. For-profit private institutions were also excluded, as they educate a small proportion of undergraduates when compared to two-year public or community college, and not-for-profit private and public four-year schools.
Appendix B: SkillUp Pulse Survey Analysis Methodology
IPEDS' data limitations present a gap in understanding the educational behaviors and potential economic mobility of countless enrolled learners.28 To address the gap, we include data from the Federal Reserve Bank of Atlanta's partner SkillUp Coalition, a nonprofit that connects individuals to careers and non-degree job training. SkillUp conducts a triannual pulse survey of its users, which provides unique insight into enrollment patterns of non-degree programs.
- About SkillUp Coalition and its partnership with the Federal Reserve
SkillUp Coalition is a nonprofit that helps individuals secure high-opportunity employment, focusing on non-degree career pathways that provide livable wages and support the jobseeker from start to finish. SkillUp currently has over 17,500 users (and counting) and, since 2022, has conducted pulse surveys of these users with plans to track these users for several years. SkillUp uses the survey results to inform their activities and estimate key metrics and outcomes. They also use this data to provide critical information on workplace dynamics, including whether nontraditional workers truly have the means of succeeding, thriving, and upskilling within their company or organization. The Fed began partnering with SkillUp in late 2023 and was able to add a selection of questions that provide insight on respondents' financial well-being in addition to their labor market experience. - SkillUp platform and user acquisition
SkillUp drives user acquisition through a mix of paid, organic, and referral traffic. Paid efforts span Google Search, Meta, YouTube, LinkedIn, Reddit, TikTok, AudioGo (Spotify, iHeartRadio, Podcasts), third-party apps like Propel/SnapEBT and more, leveraging search and diverse creative display formats to attract job seekers. Organic (web, social, email, blog) and partner referral traffic are also significant drivers, including partnerships with American Student Assistance (ASA), Jobs For the Future (JFF), Opportunity@Work, Stand Together, Goodwill, and others. All outreach uses interest and market-based parameters for users who are seeking career advancement, focusing heavily on individuals without a four-year degree and skilled through alternative routes (or STARs).
SkillUp emphasizes living-wage careers in medical, technology, business, logistics, and manufacturing fields, ensuring all opportunities meet quality standards. Examples of jobs include information technology support specialist, medical coder, solar technician, and data analyst. Additional promotion is also given to remote job opportunities, youth-focused campaigns, skilled trades, as well as geographic targeting tied to local job collections and training opportunities. Email and SMS campaigns also direct users to the platform. - Pulse cohort survey sample
- Survey recruitment, 2022-2024
The survey is sent via email through SurveyMonkey to everyone who created a profile with SkillUp on SkillUp.org during the designated cohort time frame. Each cohort receives the survey for two years; the first cohort rolled off in January 2025. The initial survey deployment on December 19, 2022, was sent via email to the 9,272 users who had created a profile to-date. Anyone who completed the survey received a $10 Visa gift card and was included in Cohort 1 for future surveys. From the initial 2022 survey through the last deployment of 2024, the link to each survey was sent to (1) previous cohorts (comprised of individuals who responded to the first survey they received from SkillUp), and (2) everyone who created a profile on SkillUp's platform since the last survey was fielded. Each survey is open for approximately two weeks. - Demographics
This piece specifically looks at the subset of the SkillUp sample who reported being enrolled in a postsecondary program at some point in 2024 and represents 1,536 individuals. The sample predominately comprises prime age workers (77 percent between the ages of 25-54), females (67 percent), nonwhites (69 percent), and those earning less than $40,000 annually (70 percent). - Limitations: Convenience sample and nature of collection
All survey respondents are engaged with SkillUp in some capacity; that is, they are seeking to improve their skills, are looking for a different job, are seeking employment placement support services, and so on. As a result, the sample is biased toward workers seeking to improve their employment outcomes. These individuals may be more confident in their job prospects than the general population. They also may be more likely to be successful in the labor market because they are utilizing SkillUp resources.
- Survey recruitment, 2022-2024
Comments to the corresponding author are welcome at jacob.walker@atl.frb.org.
The views expressed here are those of the authors' and not necessarily those of the Federal Reserve Bank of Atlanta or the Federal Reserve System. Any remaining errors are the authors' responsibility. The Federal Reserve Bank of Atlanta's Community and Economic Development function supports the Central Bank's mandate of stable prices and maximum employment by helping improve the economic opportunity of low- and moderate-income (LMI) individuals and underserved places for a stronger economy for all Americans. Community development is one of the Federal Reserve's core functions and this responsibility is rooted in its mandates from Congress. Our Workforce Currents series addresses emerging and critical issues in workforce development. Find more research, use data tools, and sign up for email updates at Community & Economic Development.
- 1 See Tiffani Horton and Elizabeth Bogue Simpson, "Worker Voices Special Brief: Pursuing Advancement through Personal Investment," Fed Communities, 2024, and US Chamber of Commerce and The College Board. "New Hire Readiness Report 2025," US Chamber of Commerce, accessed February 23, 2026.
- 2Institute of Education Sciences, "Postsecondary Education," US Department of Education, accessed February 23, 2026.
- 3 See Organization for Economic Co-operation and Development, "Education at a Glance 2025: OECD Indicators," OCED Publishing, September 9, 2025.
- 4 For more information on institutional types included in this analysis please refer to Appendix A.
- 5 SkillUp Coalition is a nonprofit that provides a career navigation platform for job training and career opportunities designed to "enable job seekers to break into new careers regardless of their degree-holding status."
- 6 Anthony P. Carnevale, Jeff Strohl, Kathryn Peltier Campbell, Artem Gulish, et al., "Learning and Earning by Degrees: Gains in College Degree Attainment Have Enriched the Nation and Every State, but Racial and Gender Inequality Persists," Georgetown University Center on Education and the Workforce, 2024.
- 7 National Student Clearinghouse Research Center, "Clearinghouse Enrollment Insights, Annual Series of Enrollment Reports" (2026).
- 8 See Mathematica, "Education-to-Workforce Indicator Framework, Disaggregate: Age Group (For Example, Adult Learners)," accessed February 23, 2026, and Esteban Aucejo and Zachary Tobin, "Assessing Racial Disparities in Postsecondary Education," Arizona State University, October 5, 2021.
- 9 Credential Engine, "Counting Credentials, In Context: 2025: The Opportunities of Digital Credentials," Credential Engine, December 2025.
- 10 National Student Clearinghouse Research Center, "Clearinghouse Enrollment Insights," National Student Clearinghouse, January 15, 2026.
- 11 Ibid.
- 12 Iris Palmer, "An Explainer: Non-degree vs Non-credit programs," New America, March 24, 2021.
- 13 Federal Reserve Bank of Richmond, "First Look: The 2024 Survey of Community College Outcomes," The Survey of Community College Outcomes, February 25, 2025.
- 14 Laura Dawson Ullrich and Jacob Walker, "Non-Credit Workforce Programs at Community Colleges," Federal Reserve Bank of Richmond, February 22, 2024.
- 15 Ibid.
- 16 Di Xu, Kelli Bird, Michael Cooper, and Benjamin Castleman, "Noncredit Career Technical Education, Industry Credentials, and Labor Market Outcomes," University of California Irvine Education Research Initiative, Policy Brief 2, November 28, 2023, and Peter Riley Bahr and Rooney Columbus, "Labor Market Returns to Community College Noncredit Occupational Education," Educational Evaluation and Policy Analysis, November 17, 2025.
- 17 Wesley Whistle, "Workforce Pell: What You Need to Know," New America, October 22, 2025.
- 18 According to NCES, non-traditional students are often defined by age (older than 24), enrollment status, financial means, family status, employment status, and/or being enrolled in a non-degree program. See National Center for Education Statistics (NCES), "Nontraditional Undergraduates/Definitions and Data," NCES, accessed March 31, 2026.
- 19 For SkillUp demographic data, "Non-white" includes Native American or Alaska Native, Middle Eastern or North African, Multiracial/Multiethnic, Asian, Hispanic or Latino, and Black or African American. "Non-white" when referencing IPEDS data includes American Indian or Alaska Native, Asian, Black or African American, Hispanic, Native Hawaiian or Other Pacific Islander, and two or more races.
- 20 Anthony P. Carnevale and Nicole Smith, "Balancing Work and Learning: Implications for Low-Income Students," Georgetown University Center on Education and the Workforce, 2018, accessed March 5, 2026.
- 21 Ilan Levine, "Interest Surging in Nondegree Credentials but How Do Students Finance Them?," The Pew Charitable Trusts, October 23, 2025.
- 22 Guy Berger, Sherry Seibel, Scott Spitze, and Suzanne Towns, "The Importance of Understanding Non-Degree Credential Quality," The Burning Glass Institute, April 14, 2024.
- 23 Lindsey Reichlin Cruse, Jennifer Stiddard, Rodrick Taylor, and Jeannine LaPrad, "The Non-Degree Quality Imperative," National Skills Coalition, July 19, 2023.
- 24 Tiffani Horton and Elizabeth Bogue Simpson, "Pursuing Advancement through Personal Investment," Fed Communities, January 10, 2024.
- 25 See The Pell Grant proxy: A ubiquitous but flawed measure of low-income student enrollment.
- 26 Federal Student Aid, "Federal Grant Program," US Department of Education, accessed February 23, 2026.
- 27 National Association of Student Financial Aid Administrators (NASFAA), "National Student Aid Profile: Overview of 2024 Federal Programs," NASFAA, accessed February 23, 2026.
- 28 Elizabeth Bogue Simpson, "The Power of Anecdotal Data," Federal Reserve Bank of Atlanta, Center for Workforce and Economic Opportunity, August 21, 2024.