
The Geography of AI Demand in the Southeast: Patterns of Growth and Labor Market Structure
August 13, 2026

Workforce Currents 2026-04
Digital Object Identifier: https://doi.org/10.29338/wc2026-04
Where is the artificial intelligence demand in the Southeast?
Artificial intelligence (AI) tools have moved from niche to a broadly discussed force in the labor market, with a growing body of research exploring how AI may shape skill demand and broader labor market outcomes.1 Much of the current research suggests that the effects of AI are unlikely to be evenly distributed across occupations and education levels, and that differences in regional and local labor market composition may shape how these changes unfold.2 At the same time, there remains considerable uncertainty about how these effects will materialize in practice.3 Some analyses focus on how AI affects occupations or workers, while others examine firm adoption or emerging skill demand.
What is often less clear is how these changes are unfolding across local regions—how the demand for AI-related skills is distributed geographically, and whether certain labor markets are becoming more specialized or intensive in their use of these skills.4 These patterns extend beyond geography, reflecting differences in both the intensity of AI skill requirements and how AI hiring is distributed across employers within local labor markets.
Building on prior Atlanta Fed work examining how AI demand varies by educational requirements,5 this analysis shifts the focus to geography, examining how AI demand is distributed across the Southeast and how it varies across regional labor markets. Using Lightcast job postings data and a defined set of AI-related skills,6 it looks at how demand varies across metropolitan areas and counties, and how those patterns have evolved over time. In addition to geography, the analysis considers the intensity of AI skill requirements within job postings and the degree to which demand is concentrated among employers. Together, these findings help provide a clearer picture of where AI demand is emerging, how concentrated it remains across regions and employers, and how regional labor markets may shape that demand.
Key takeaways:
- The share of job postings requiring AI skills has increased steadily across southeastern states since 2010, with growth accelerating in recent years, though overall levels remain below the national average in most states across the region.
- AI demand is highly concentrated within a small set of large metropolitan areas, with limited diffusion into smaller labor markets despite overall growth.
- Most AI-related job postings require only a small number of AI skills, suggesting that these skills are often incorporated into broader roles rather than concentrated in highly specialized positions.
- AI demand is concentrated in a relatively consistent set of technical and adjacent occupations across states, particularly computer and mathematical roles, engineering, and business operations.
- The structure of AI demand varies by market size: larger metropolitan areas tend to have more diversified employer participation, while smaller markets show higher levels of employer concentration.
What are the trends and geographic distribution in AI-related job demand?
The analysis begins by examining how AI-related job demand has evolved over time and how it is distributed across the region. Understanding these patterns provides a foundation for interpreting the broader structure of AI labor markets, including where demand is emerging and how concentrated it remains across places.
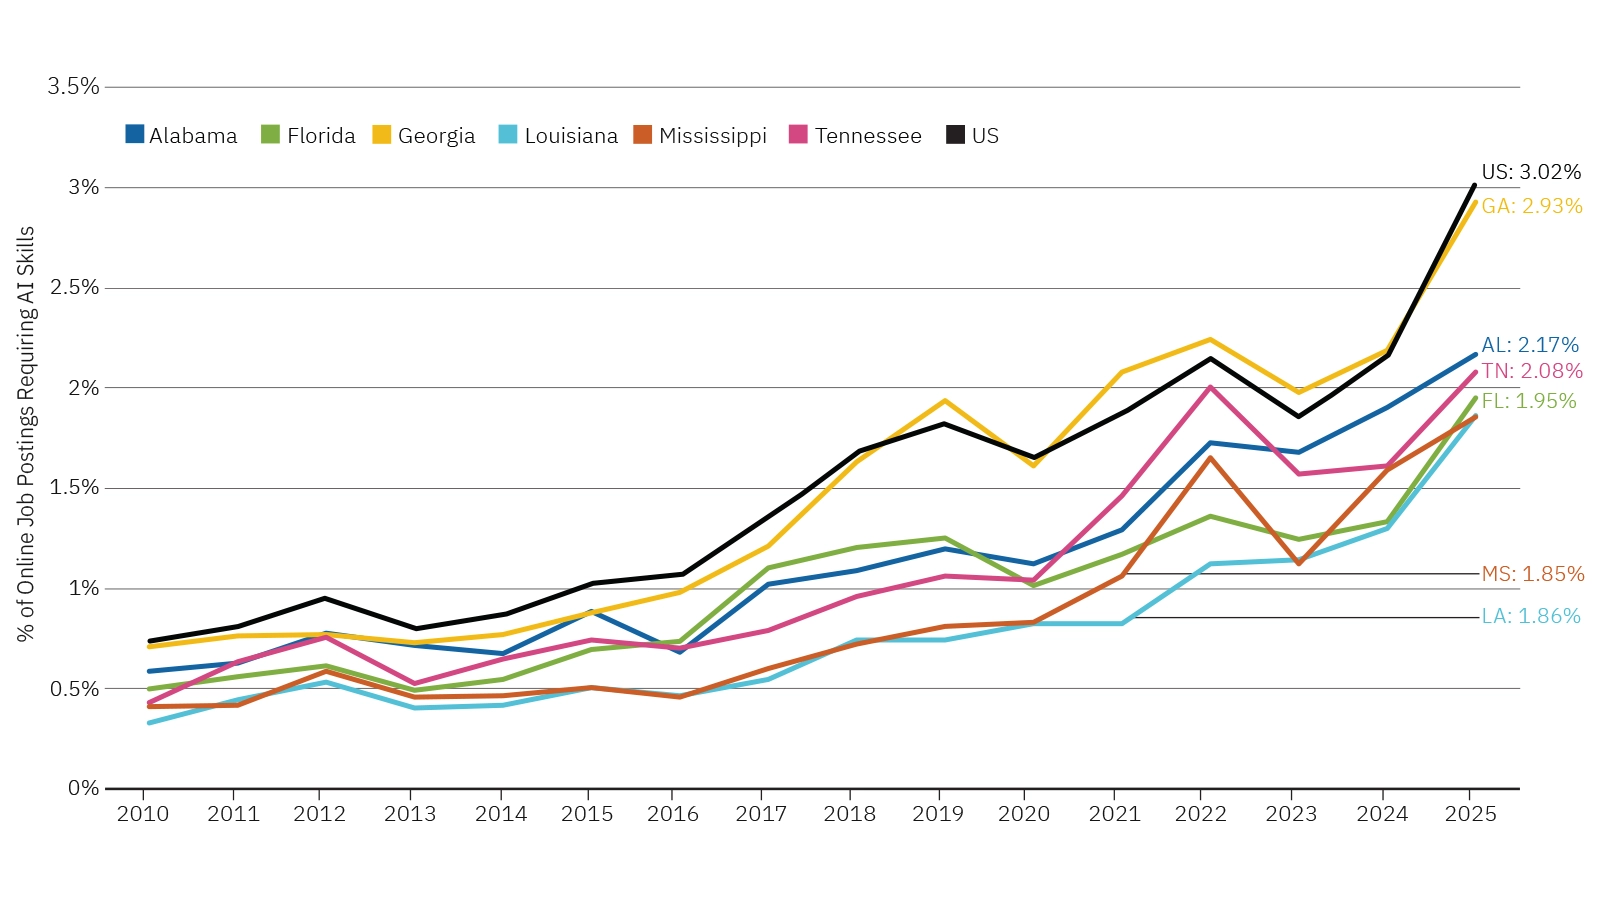
Figure 1 shows how the share of online job postings requiring AI skills has changed across six states in the Southeast from 2010 through 2025. Although AI-related postings still represent a relatively small share of total job postings, that share has increased steadily over time, with more noticeable growth in recent years. AI-related hiring increased across all states over the period, though the scale of demand differs substantially across the region. As of December 2025, Georgia (2.93 percent) leads the region by a substantial margin and is only slightly below the national average of three percent.
Figure 1
AI Demand Across the Southeast | 2010–2025
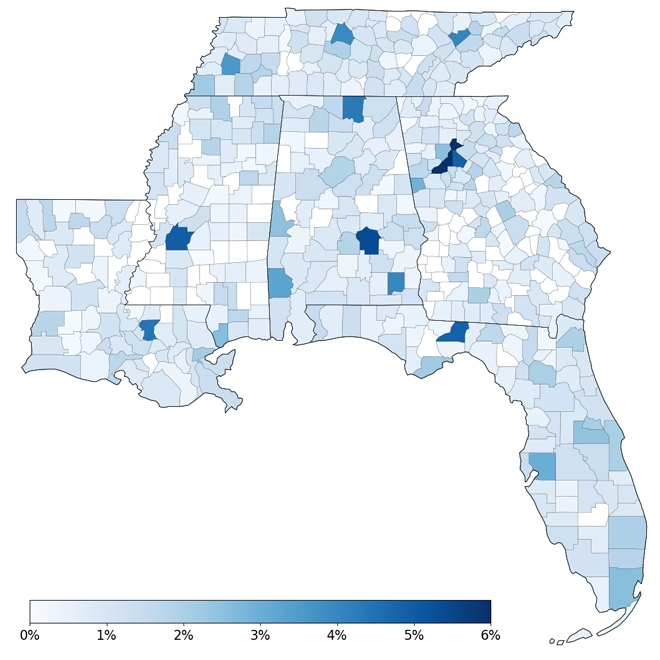
Looking across geography, figure 2 maps the share of job postings requiring AI skills at the county level in 2025. To reduce volatility in smaller labor markets, only counties with at least 1,000 job postings and 500 AI-related postings are included. AI demand remains geographically concentrated within and around major metropolitan corridors, with comparatively limited activity across many rural counties.
Figure 2
County-level AI demand across the Southeast | 2025
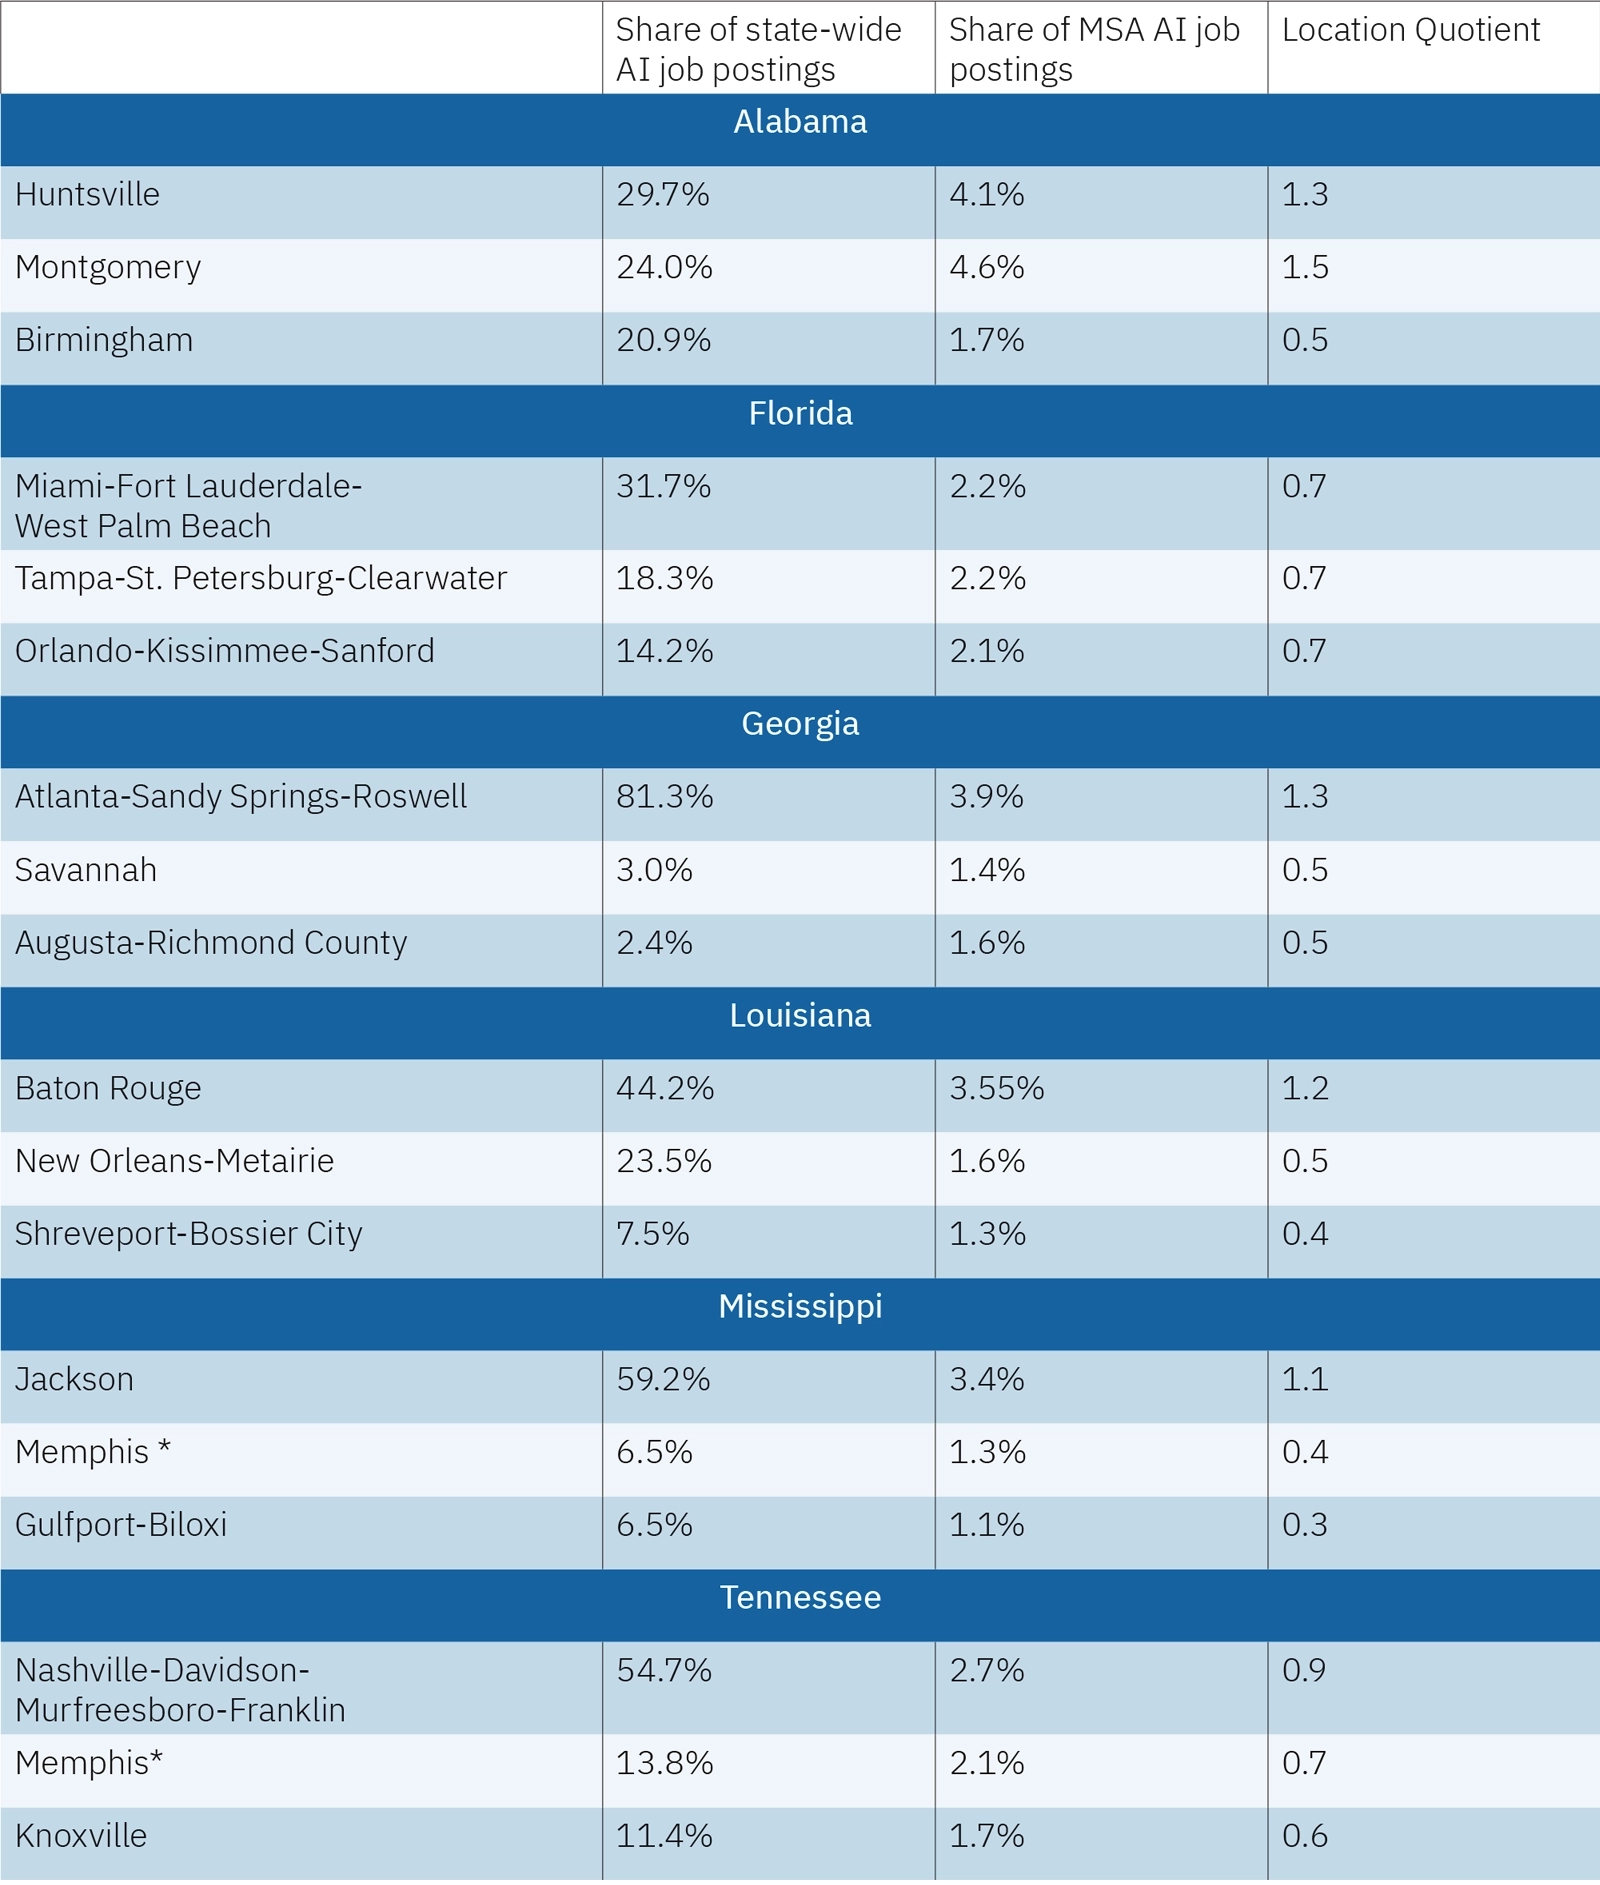
While counties help illustrate local spatial variation, metropolitan statistical areas (MSAs) provide a more complete view of integrated labor markets and regional economic concentration. Table 1 summarizes AI demand across major metropolitan areas using each MSA’s share of statewide AI postings and the share of postings within the MSA requiring AI skills. A third measure, location quotient (LQ), provides a measure of relative specialization by comparing local AI demand to the national average. A value of 1.0 means that the share of postings requiring AI skills in the local area is the same as the national average. While county AI share reflects local intensity and statewide share captures overall contribution, LQ indicates relative specialization in AI skills.
Table 1
Top MSAs by Share of Statewide AI Job Postings
Source: Author’s calculations of Lightcast data.
Some metropolitan areas combine large shares of statewide postings with above-average specialization. Others account for substantial hiring volume despite lower relative specialization.
Regional patterns also vary in how geographically concentrated AI demand is within metropolitan areas. In Georgia, the Atlanta metropolitan area accounts for more than four-fifths of statewide AI postings, reflecting the outsized role of a single dominant labor market. Mississippi and Tennessee show similar concentrations, with Jackson and Nashville accounting for the largest shares of AI hiring in their respective states. In contrast, Florida’s AI demand is spread across several large metropolitan regions rather than concentrated within a single hub, while Alabama also shows a relatively balanced distribution across Huntsville, Montgomery, and Birmingham.
What can skill intensity and depth of AI skill demand tell us?
The number of skills listed in a job posting offers one way to examine employer demand for AI skills. While skills alone cannot fully determine the degree of occupational specialization, they help show how extensively AI-related capabilities are requested in job requirements.
Figure 3 shows the distribution of AI job postings across metropolitan areas by skill intensity, group into postings requiring from one to four, five to nine, and 10 or more AI skills. Within the Southeast, the majority of AI-related postings fall into the lowest range, requiring between one and four skills. Postings requiring larger numbers of AI skills make up a relatively small share of overall demand.
Figure 3
Share of Job Postings Requiring AI Skill by Intensity:
Top 15 MSAs by AI Share
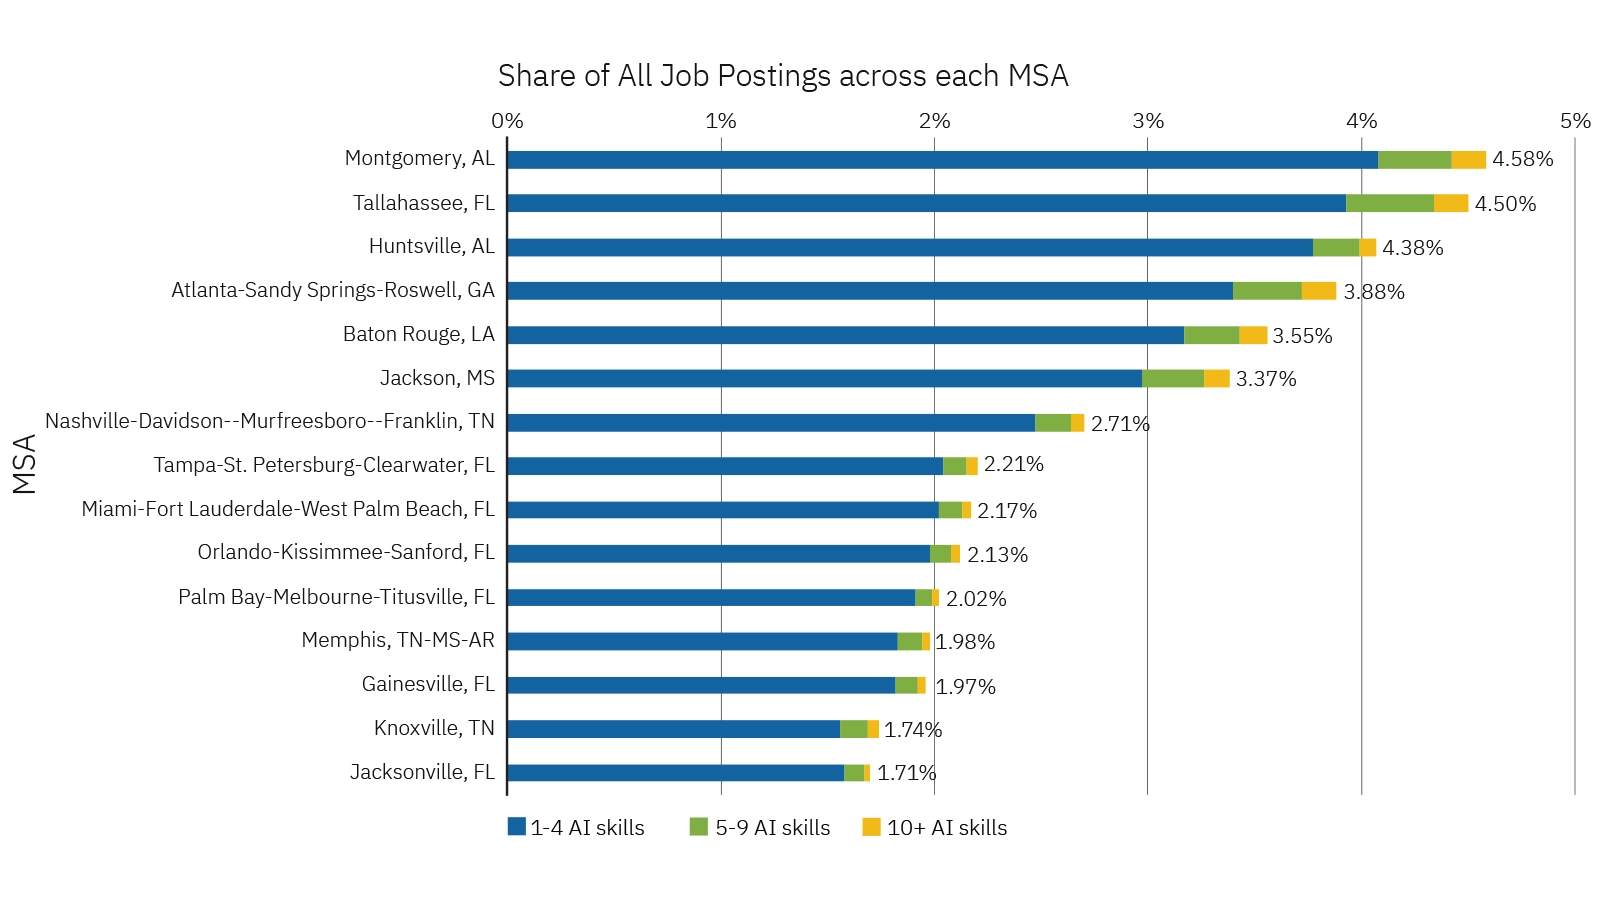
Differences in skill intensity across metropolitan areas remain relatively limited. While some metro areas show slightly higher shares of postings containing broader AI skill requirements, the differences are modest. Postings requiring between one and four AI skills tend to rely on a similar set of capabilities, including artificial intelligence, machine learning, predictive analytics, robots and generative AI-related capabilities. Broad familiarity with AI tools and concepts has increased in relevance across a wider set of occupations, even as highly AI-intensive roles remain comparatively limited.
Which occupations drive demand?
Beyond the AI skills themselves, another important question is which occupations are driving overall demand. Figure 4 shows how AI job postings are distributed across top occupations. Consistent with prior findings,7 demand is concentrated in computer and mathematical roles, with additional activity in engineering, business operations, and the sciences. While the relative shares shift modestly across states, the overall composition remains broadly similar.
Figure 4
Occupational Composition of AI Job Postings by State
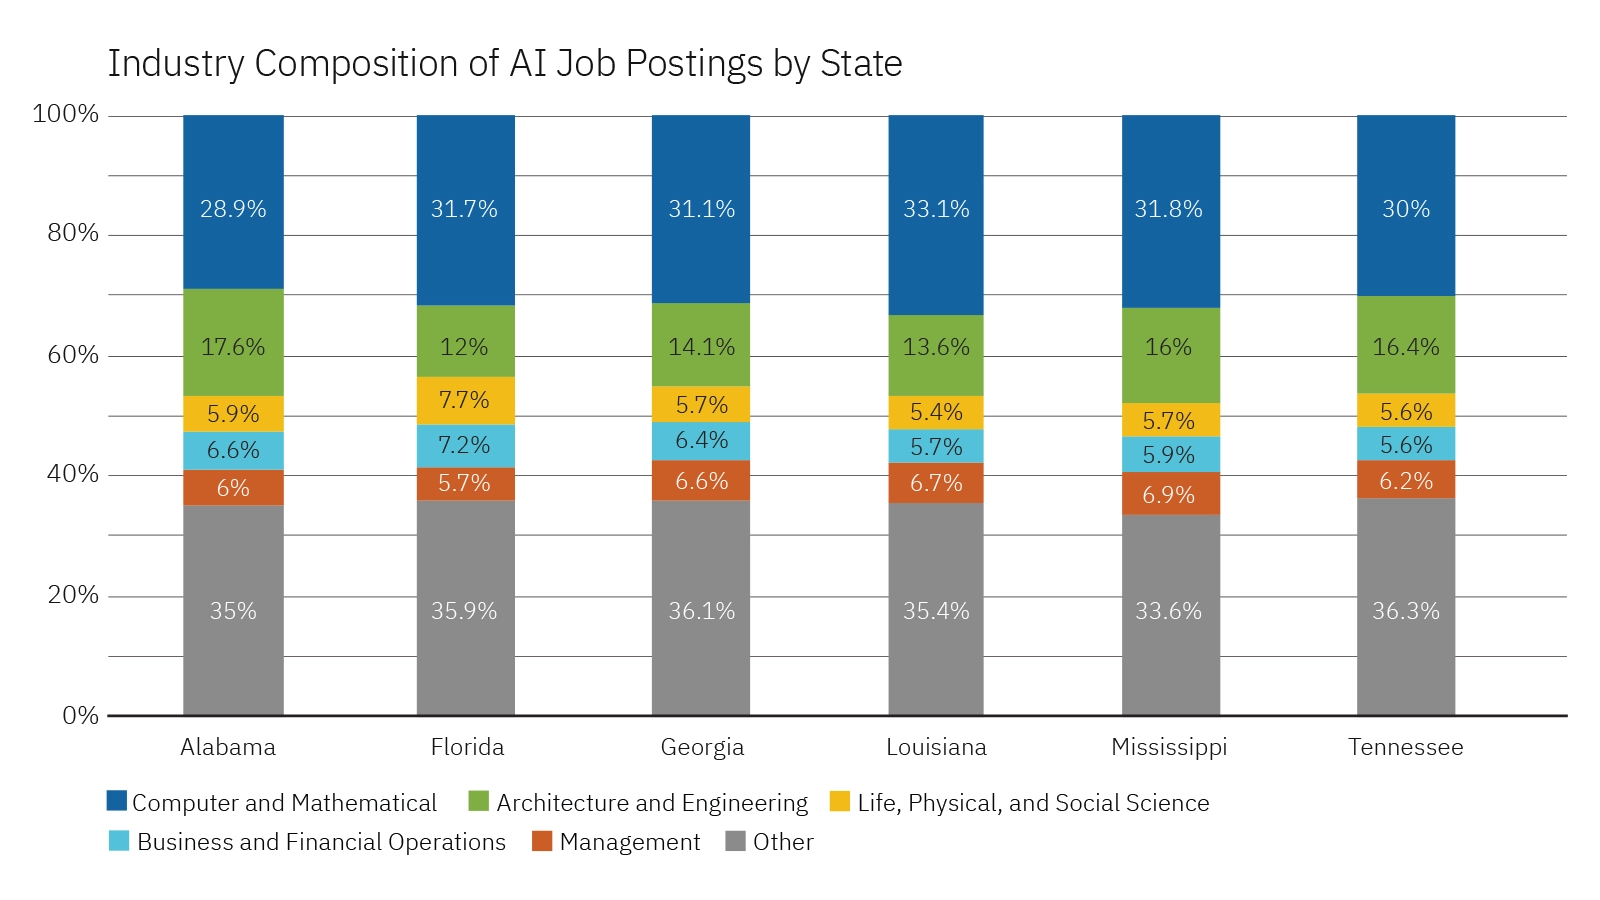
Source: Author’s calculations of Lightcast data. Occupational shares are based on job postings that could be assigned to an occupation code. Since a portion of postings cannot be classified, the data are normalized within the subset of classified postings so that percentages sum to 100 percent. As a result, the shares shown reflect the distribution of AI-related demand across observed occupations rather than across all job postings.
To date, AI demand is not highly differentiated by region in terms of the types of roles or industries driving hiring. Instead, AI demand remains anchored in a common set of technical and adjacent occupations.
The occupational composition of AI demand changes relatively little across states. AI-related hiring remains concentrated within many of the same broad occupational categories across the region rather than breaking into sharply different patterns than typically observed. Differences in the overall scale of AI demand across states may partly reflect the size and composition of existing occupational and industry structures, including concentrations of technology, finance, engineering, and science-related work.
Assessing employer concentration and market structure
Another dimension of AI demand is how it is structured across employers. In some markets, AI demand is spread across a broad set of firms, while in others it is driven by a smaller number of employers. This distinction helps show whether AI-related hiring is distributed across a range of employers or concentrated among a smaller number of firms.
Figure 5 plots MSAs by their level of AI specialization (X=LQ) and employer concentration (Y=Herfindahl-Hirschman Index or HHI). The HHI captures how evenly AI-related job postings are distributed across employers. Higher values closer to 1 indicate greater concentration, where a smaller number of employers account for a larger share of postings, while lower values closer to 0 reflect a more distributed employer base. Markets to the right of the vertical line have location quotients above 1.0, showing metropolitan areas where AI demand is above the national average, while markets to the left have lower relative specialization. Points higher on the chart exhibit greater employer concentration, meaning a smaller number of employers account for a larger share of AI-related hiring. Bubble size reflects the total volume of AI job postings within each metropolitan area.
Plotted against location quotients, this chart provides a way to compare both the concentration and structure of AI demand. Each point represents a metropolitan area, with an MSA’s position reflecting its level of specialization and employer concentration, and bubble size indicating the total number of AI job postings within that MSA.
Figure 5
Employer Concentration and AI Specialization Across Southeastern MSAs
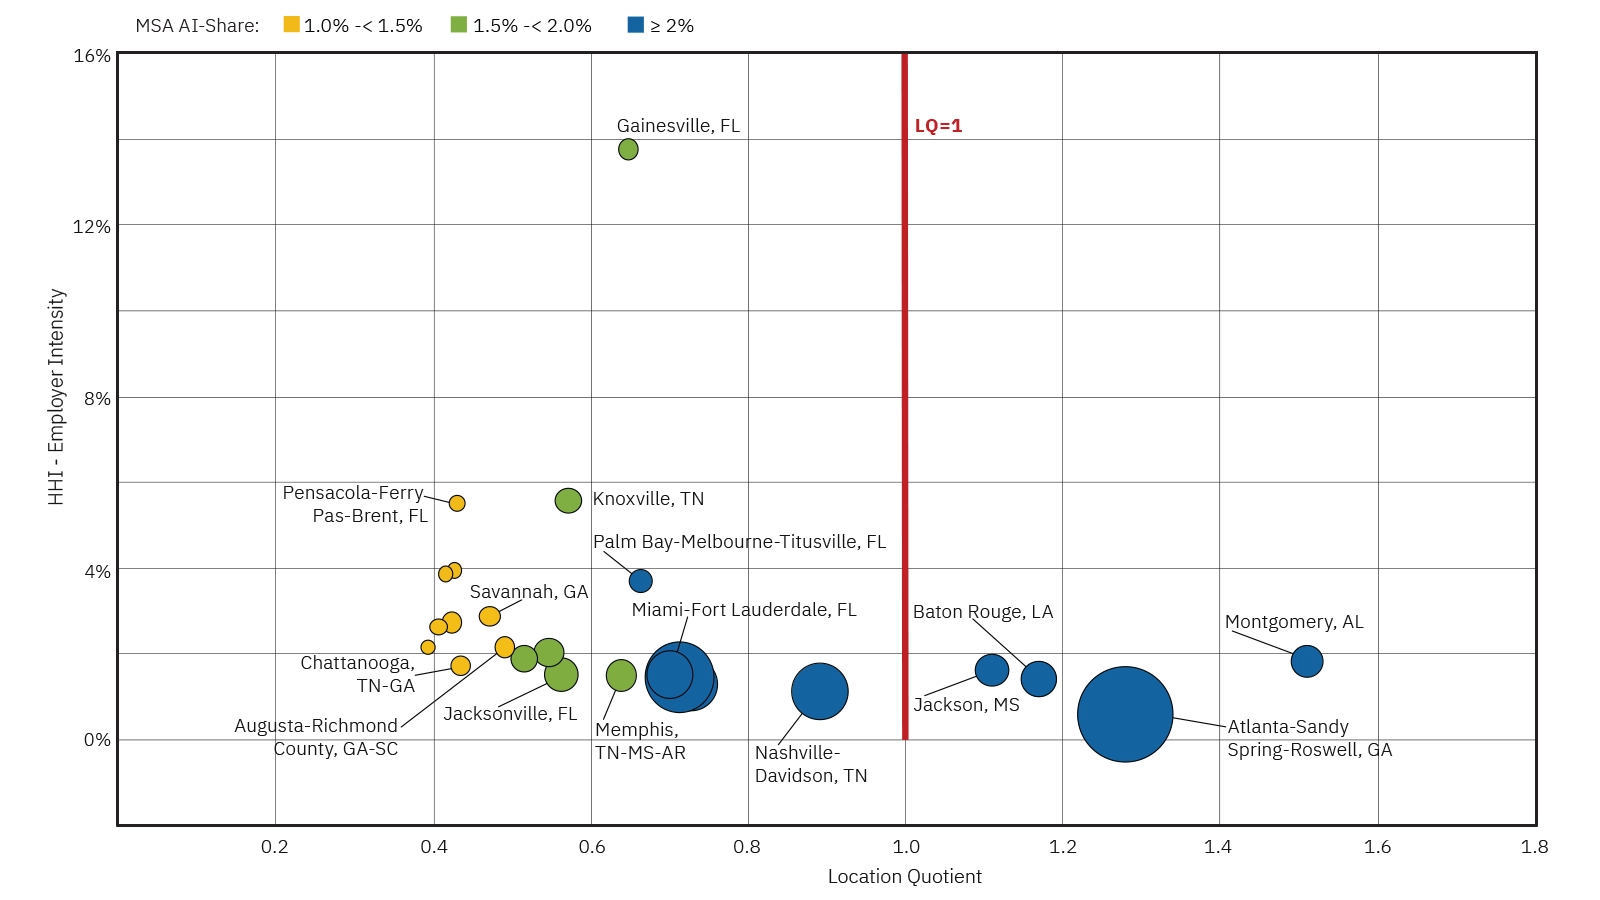
Most metropolitan labor markets exhibit relatively low levels of employer concentration, with AI hiring generally distributed across a broad employer base. Larger metropolitan areas also tend to combine higher levels of AI specialization with diversified employer participation. On the other hand, smaller labor markets more often show modestly higher concentration levels, potentially reflecting reliance on a narrower set of employers.
Examples help highlight these differences. Atlanta stands out as a highly specialized but broadly distributed market, combining relatively high location quotient with low employer concentration. Miami and Nashville show relatively broad employer participation alongside location quotients that remain just below the national average.
In contrast, smaller markets more often show higher levels of concentration. Gainesville, Florida, for example, stands out as an outlier, with a relatively higher HHI despite only moderate levels of specialization. AI hiring in that market could potentially be driven by a narrower set of firms. Other small metros, such as Knoxville or Pensacola, also show relatively higher levels of cross-employer concentration paired with lower levels of AI specialization. Even with variation in AI specialization across labor markets, most metropolitan areas continue to show relatively low levels of employer concentration.
What is the future of AI-driven job demand in the Southeast?
AI-related job demand has grown rapidly across the Southeast, but its geographic footprint remains uneven. AI demand is concentrated in and around larger metropolitan labor markets. It also remains concentrated within many of the same occupational categories that already play an outsized role in regional economies, including computer and mathematical occupations, business and financial operations, engineering, management, and the sciences.
How that demand is distributed across employers also varies meaningfully across metropolitan areas. These differences may matter for how workers encounter AI-related opportunities within local labor markets. Larger and more diversified metros may provide a wider range of entry points for workers to engage with AI-related skills, including in occupations where those skills are applied at lower levels of intensity. Opportunities in smaller markets are tied to a narrower set of firms or occupations.
Several important questions remain open for future research. To what extent do regional differences in AI demand reflect industry mix and occupational composition versus differences in technology adoption across firms and labor markets? Do larger and more diversified metropolitan areas support broader diffusion of AI-related hiring across employers and occupations, or are these patterns mainly driven by the concentration of AI-intensive industries within particular regions? Additional analysis comparing regions with similar industry structures could help clarify how employer concentration, labor market scale, and regional economic organization shape the spread of AI-related demand over time.
Appendix: Methodology
This analysis uses online job postings data from Lightcast to examine demand for AI skills across the Southeast. Lightcast’s Open Skills Library contains more than 30,000 standardized skills, defined as competencies associated with specific tasks, tools, or knowledge areas. From this taxonomy, a set of AI-related skills was constructed by combining skills from the artificial intelligence/machine learning (AI/ML) and natural language processing (NLP) categories with additional skills identified through keyword searches and manual review. A job posting is classified as AI-related if it includes at least one of these skills. This approach may capture roles that incorporate AI-related tools without explicitly labeling them as such and may not include all roles where AI is used but not specified in postings. As with other research that relies on job postings, the results should be interpreted as indicating patterns and trends in AI-related hiring rather than a complete measure of demand.
In addition to identifying AI-related postings, the analysis examines the intensity of AI skill demand within job postings. Skill intensity is measured as the number of distinct AI-related skills listed with a posting. Postings are grouped into ranges (for example, 1-4, 5-9, and 10 or more AI skills) to capture differences between roles that require limited exposure to AI and those that require more specialized or technical roles.
To assess how AI demand is distributed across regions, the analysis calculates location quotient (LQ) for each geography. The LQ compares the share of job postings requiring AI skills in a given region to the national average. This involves taking the proportion of postings in a region that require AI skills and dividing it by the proportion of postings nationally that require AI skills. An LQ greater than 1 indicates that AI demand is more concentrated in that region relative to the nation, while an LQ below 1 indicates lower relative concentration. This measure helps identify regions with higher levels of specialization in AI-related hiring.
The Herfindahl-Hirschman Index (HHI) is used to calculate the concentration of employer demand. For each geography, HHI is calculated by first determining each employer’s share of AI-related job postings within that region, then squaring those shares and summing them across all employers. This approach gives greater weight to employers with larger shares of postings, allowing the index to capture the degree to which demand is concentrated among a small number of firms. Values closer to zero indicate a more competitive market with many employers contributing to demand, while higher values closer to 1 indicate that AI hiring is driven by a smaller set of employers.
The views expressed here are those of the authors' and not necessarily those of the Federal Reserve Bank of Atlanta or the Federal Reserve System. Any remaining errors are the authors' responsibility. The Federal Reserve Bank of Atlanta's Community and Economic Development function supports the Central Bank's mandate of stable prices and maximum employment by helping improve the economic opportunity of low- and moderate-income (LMI) individuals and underserved places for a stronger economy for all Americans. Community development is one of the Federal Reserve's core functions and this responsibility is rooted in its mandates from Congress. Our Workforce Currents series addresses emerging and critical issues in workforce development. Find more research, use data tools, and sign up for email updates at Community & Economic Development.
- 1 Salome Baslandze, Zach Edwards, and John Graham, et al., "Artificial Intelligence, Productivity, and the Workforce: Evidence from Corporate Executives," Working Paper 2026-4 (Federal Reserve Bank of Atlanta, March 25, 2026)
- 2 US Department of the Treasury, "Occupational Exposure to Artificial Intelligence by Geography and Education," Working Paper 2024-02 (US Department of the Treasury, April 2024)
- 3 Oksana Leukhina, "Why AI Advancements May Push Some Workers Out of the Labor Force," On the Economy (blog) (Federal Reserve Bank of St. Louis, January 13, 2026)
- 4 Kathryn Bonney, Cory L. Breaux, Emin Dinlersoz, Lucia S. Foster, John C. Haltiwanger, and Aditya A. Pande, "The Microstructure of AI Diffusion: Evidence from Firms, Business Functions, and Worker Tasks," Working Paper 35141 (National Bureau of Economic Research, April 2026), and Kristina McElheran, J. Frank Li, Erik Brynjolfsson, et al., "AI Adoption in America: Who, What, and Where," Working Paper 31788 (National Bureau of Economic Research, October 2023).
- 5 Sergio Galeano, Nyerere Hodge, and Alexander Ruder, "By Degree(s): Measuring Employer Demand for AI Skills by Educational Requirements," Workforce Currents 2025-01 (Federal Reserve Bank of Atlanta, May 21, 2025)
- 6 Lightcast is a global workforce analytics company that supplies comprehensive datasets and insights. Learn more about Lightcast.
- 7 Galeano, Hodge, and Ruder, "By Degree(s): Measuring Employer Demand for AI Skills by Educational Requirements."