Speaking from experience, research projects often require many grueling hours of deciphering obtuse data dictionaries, recoding variable definitions to be consistent, and checking for data errors. Inevitably, you miss something, and you can only hope that it does not change your results when it's time to publish the results. It would be far less difficult if data sets came prebuilt with time-consistent variable definitions and a guidebook that makes the data relatively easy to use. Not only would research projects be more efficient, but also the research would be easier to replicate and extend.
To this end, we have worked closely with our friends at the Kansas City Fed's Center for the Advancement of Data and Research in Economics (CADRE) to produce what we call a harmonized variable and longitudinally matched (HVLM) data set. This particular data set uses the basic monthly Current Population Survey (CPS) data published by the U.S. Census Bureau and the Bureau of Labor Statistics. The HVLM data set underlies products such as the Atlanta Fed's Wage Growth Tracker and the various tools on the Atlanta Fed's Labor Force Participation Dynamics web page.
You may be wondering how this data set is different from the basic monthly CPS data available at IPUMS. Like the IPUMS-CPS data, the HVLM-CPS data set uses consistent variable names and includes identifiers for longitudinally linking individuals and households over time. Unlike the IPUMS-CPS data, the HVLM-CPS also has time-consistent variable definitions. For example, the top-coded values for the age variable in the IPUMS-CPS is not the same in all years, whereas the HVLM-CPS age variable is consistently coded by using the most restrictive age top-code. As another example, the number of race categories is not the same in every year in the IPUMS-CPS (having increased from 3 to 26), while the race variable in the HLVM-CPS data set is consistently coded by using the original three race categories. Applying these types of restrictions means that the resulting data set can be more readily used to make comparisons over time.
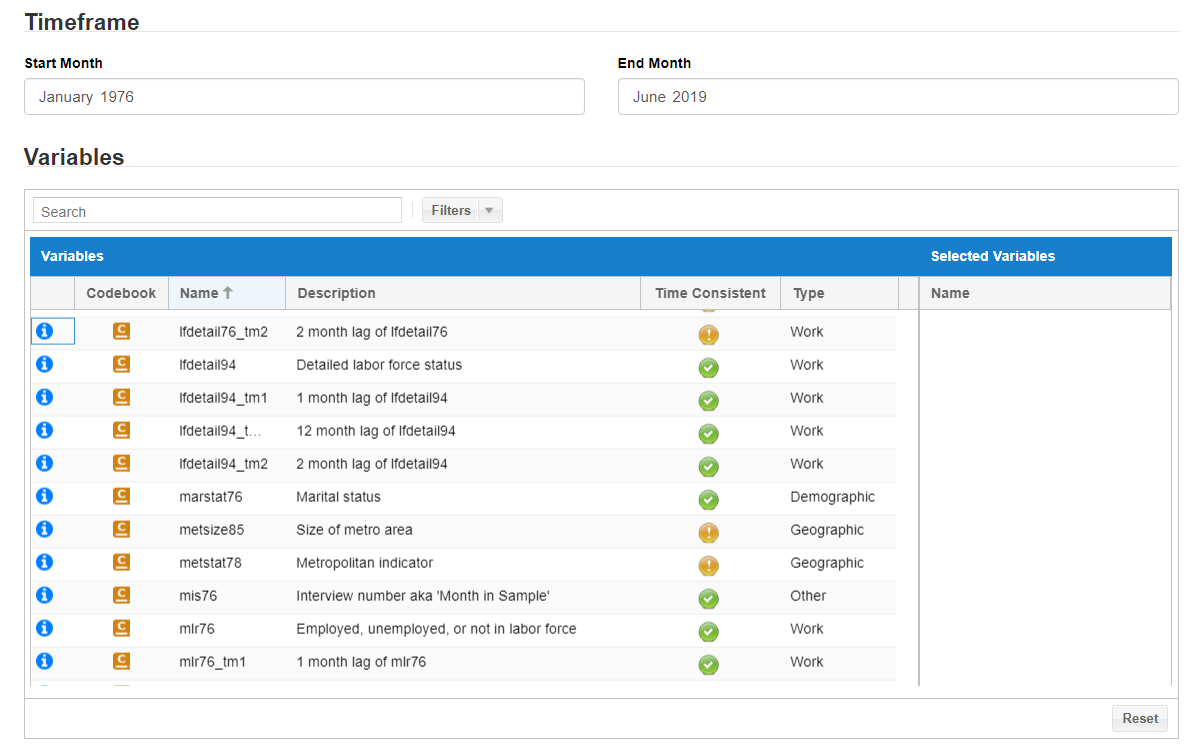
The screenshot below shows how accessible the HVLM-CPS data are. For a visual of each variable over time, click on Charts at the top to see a PDF file of time-series charts. Code Book is an Excel file containing the details of how each variable has been coded. You can see in the screenshot how each variable ends with two numbers. These two numbers correspond to the first year that variable is available. For example, mlr76 is coded with consistent values (1 = employed, 2 = unemployed and 3 = not in labor force) from 1976 until today. The Data File is a Stata (.dta) format file with variable labels already attached. For users wishing to use the panel structure of the CPS survey, lags of many variables are provided on the data set already—for example, mlr76_tm12 is an individual's labor force status from 12 months ago).

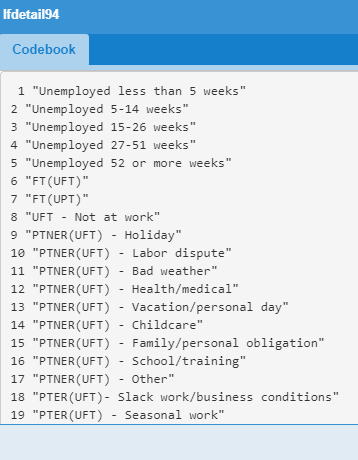
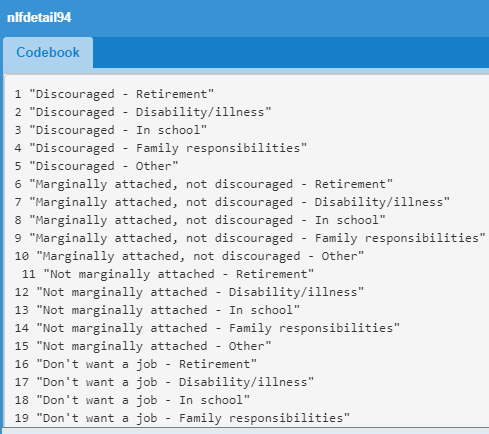
Clicking on the c icon under Code Book opens a screen with the values of the corresponding variable. The screenshot shows lfdetail94 and nlfdetail94 as examples. The first variable, lfdetail94, contains a large amount of detail on those engaged in the labor market, while nlfdetail94 contains detailed categories for those not engaged in the labor market.


The HVLM-CPS data set is freely available to download and is updated within hours of when the CPS microdata are published, thanks to sophistical coding techniques and the fast processors at the Kansas City Fed. To access the data, go to the CADRE page (using Chrome or Firefox). At the top right, select Sign in, then Google Login. Then, under schema, select Harmonized Variable and Longitudinally Matched [Atlanta Federal Reserve] (1976–Present).


 By
By