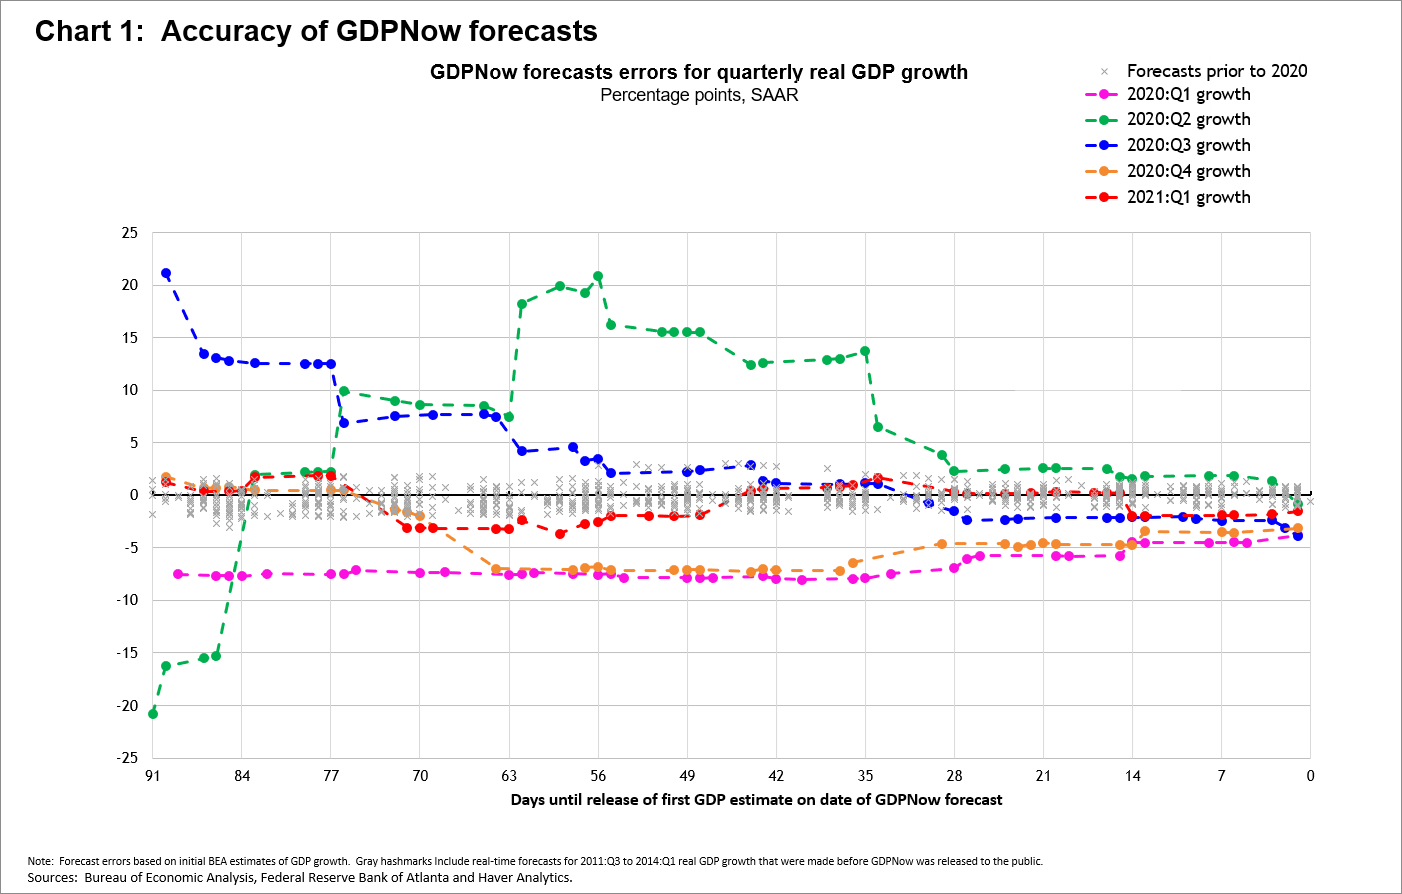
According to the U.S. Bureau of Economic Analysis (BEA), real gross domestic product (GDP) grew at an annualized rate of 6.4 percent in the first quarter of 2021, 1.5 percentage points below our final GDPNow model forecast. The size of this forecast error is large relative to GDPNow's prepandemic history but much smaller than the extremely large errors recorded last year. In short, the GDPNow model has struggled to accurately capture the unusual sources of variation in GDP caused by the COVID-19 pandemic and the various policy responses. The colored dashed lines in chart 1 show the evolution of GDPNow's forecast errors for each of the last five quarters. Unlike any of the four quarters of 2020, GDPNow's forecasts of real GDP growth last quarter was always within 5 percentage points of the BEA's first published estimate. Nevertheless, we can see that the GDPNow forecasts for GDP growth last quarter were still less accurate than before the pandemic.
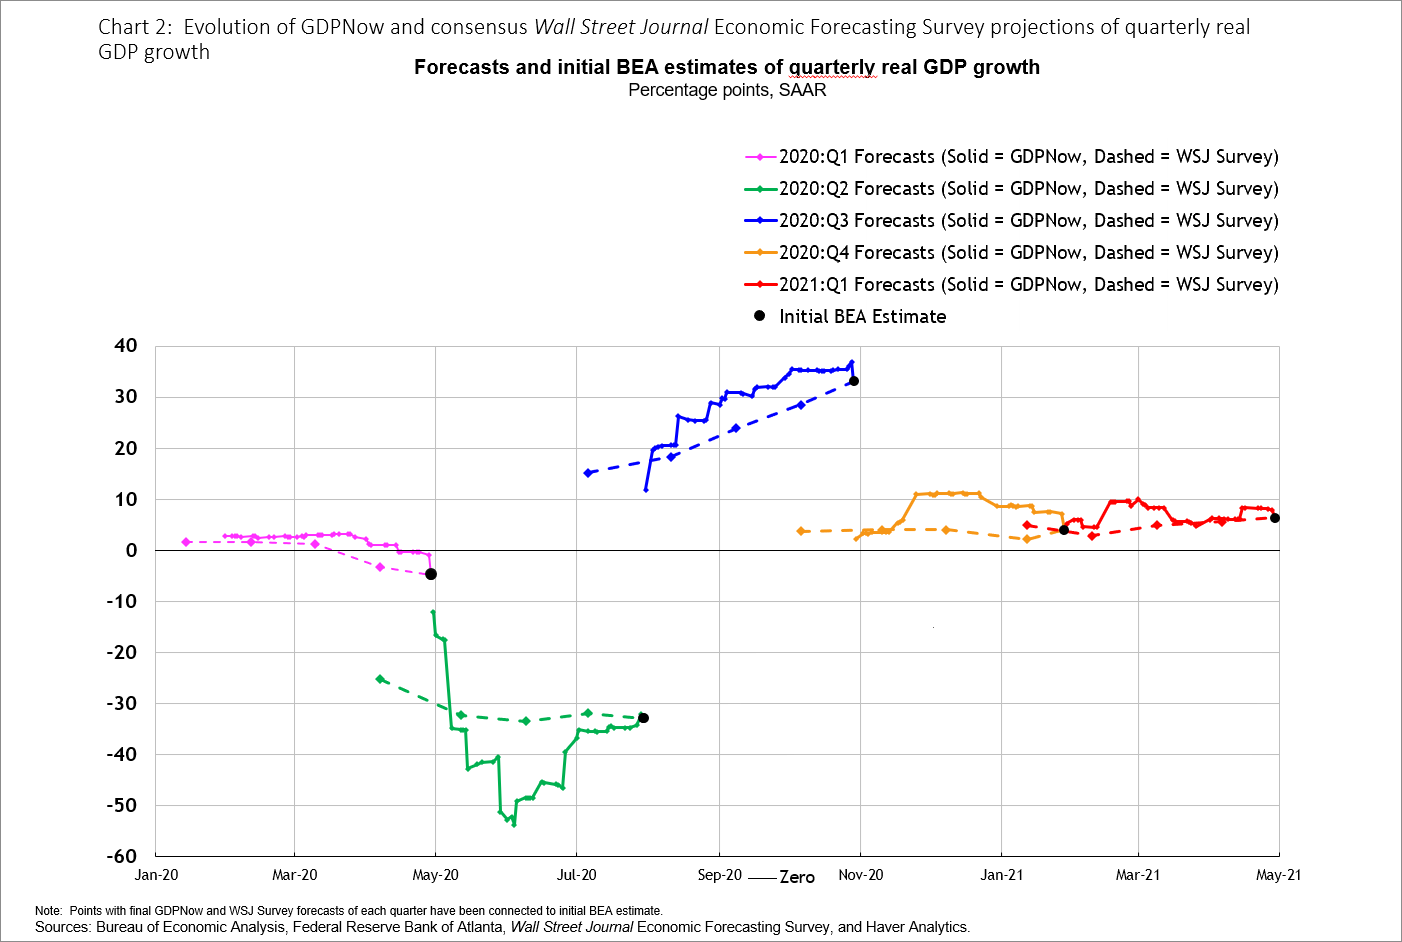
Despite the recent deterioration in GDPNow's accuracy, its forecasts over the past 15 months share some broad similarities with professional forecasts, as chart 2 shows. From mid-March to mid-May 2020, both GDPNow and the consensus Wall Street Journal Economic Forecasting Survey![]() (WSJ) forecasts of real GDP growth declined sharply. As described here, GDPNow did not anticipate the extent of the plunge in services consumption last March and the resulting impact on GDP growth for the first quarter of last year. The nosedive and rebound in economic activity last year were evident in GDPNow's forecasts for GDP growth in the second quarter of 2020. Forecasts for third-quarter GDP growth strengthened during much of the summer and early fall, and GDPNow performed as well or better than the consensus forecast over much of that period. However, for the last two quarters, GDPNow forecasts were more erratic, and generally less accurate, than the consensus.
(WSJ) forecasts of real GDP growth declined sharply. As described here, GDPNow did not anticipate the extent of the plunge in services consumption last March and the resulting impact on GDP growth for the first quarter of last year. The nosedive and rebound in economic activity last year were evident in GDPNow's forecasts for GDP growth in the second quarter of 2020. Forecasts for third-quarter GDP growth strengthened during much of the summer and early fall, and GDPNow performed as well or better than the consensus forecast over much of that period. However, for the last two quarters, GDPNow forecasts were more erratic, and generally less accurate, than the consensus.
It's not surprising that GDPNow's accuracy has deteriorated relative to the consensus of professional forecasts. Unlike GDPNow, professional forecasters have been able to use data on personal mobility and government mitigation measures (such as here![]() , here
, here![]() , here
, here![]() , and here
, and here![]() ), and a number of studies have shown that these measures relate to cross-country differences in GDP growth observed in 2020 (for example, here
), and a number of studies have shown that these measures relate to cross-country differences in GDP growth observed in 2020 (for example, here![]() and here
and here![]() ). Transportation services and leisure and hospitality accounted for half the decline in consumer spending in the first two quarters of 2020, and a number of high-frequency measures of activity in these sectors (such as here
). Transportation services and leisure and hospitality accounted for half the decline in consumer spending in the first two quarters of 2020, and a number of high-frequency measures of activity in these sectors (such as here![]() , here
, here![]() , here
, here![]() , and here
, and here![]() ) are available before official spending data
) are available before official spending data![]() are. Finally, spikes in consumer spending following the distribution of stimulus payments included in the December and March fiscal packages were evident in some high-frequency measures of consumer spending (available here
are. Finally, spikes in consumer spending following the distribution of stimulus payments included in the December and March fiscal packages were evident in some high-frequency measures of consumer spending (available here![]() and here
and here![]() ) before they were evident in the retail sales
) before they were evident in the retail sales![]() and personal income and outlays
and personal income and outlays![]() releases. In contrast, GDPNow uses a fixed methodology and source data for estimating GDP, making it much less adaptable to unusual circumstances.
releases. In contrast, GDPNow uses a fixed methodology and source data for estimating GDP, making it much less adaptable to unusual circumstances.
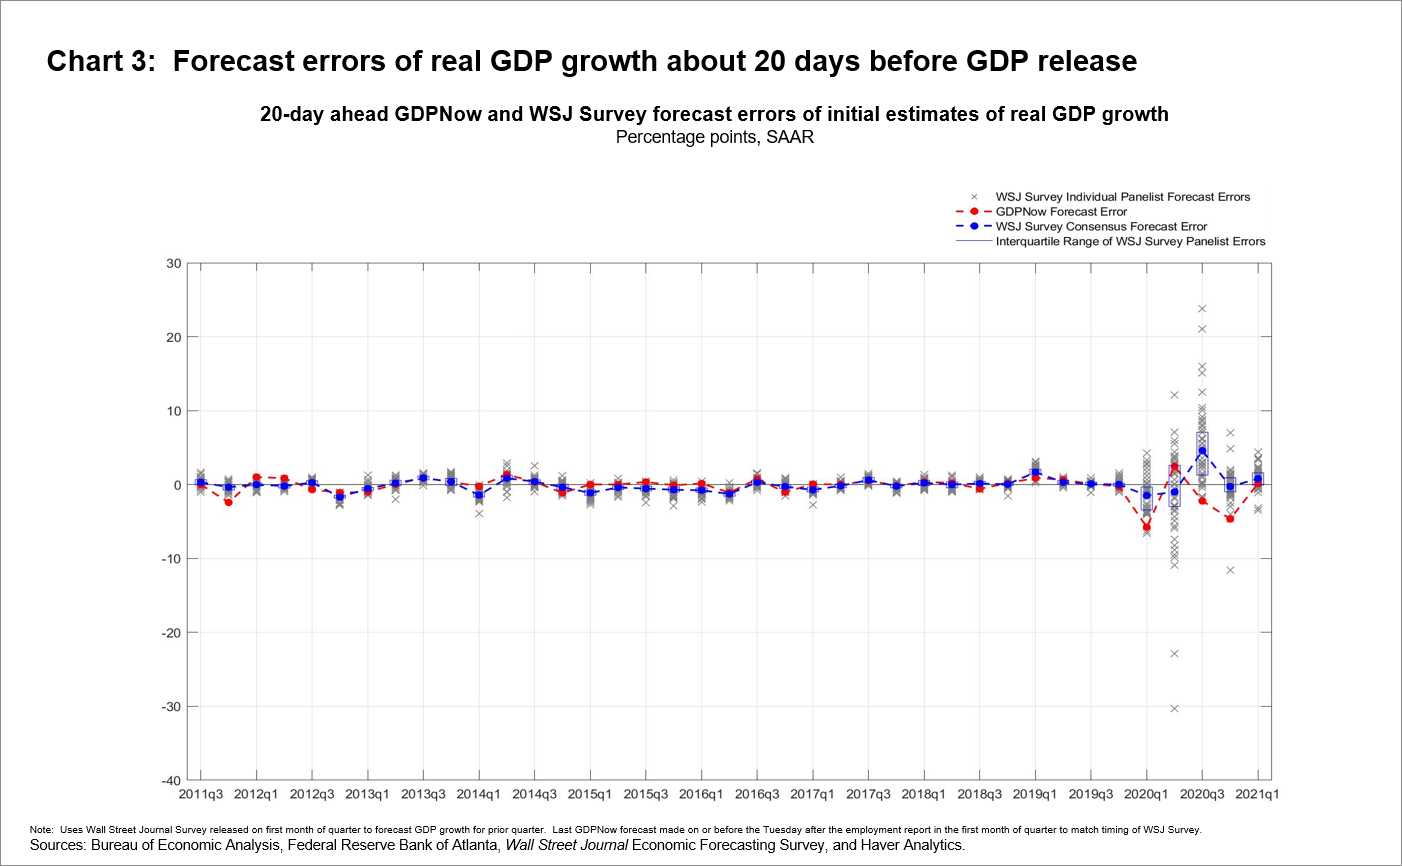
Nevertheless, GDP forecasting during the pandemic has been challenging even for professional forecasters. Chart 3 shows the distributions of GDPNow and WSJ survey panelist forecast errors of real GDP growth for projections made about 20 days before the BEA's release of its initial GDP estimate. The gray cross marks represent individual WSJ panelist errors, and the blue rectangles represent interquartile ranges (IQRs), or middle halves, of the distribution of their forecast errors. The IQRs widened during the pandemic, and a number of panelists had errors in the middle two quarters of last year that were dramatically larger than usual.
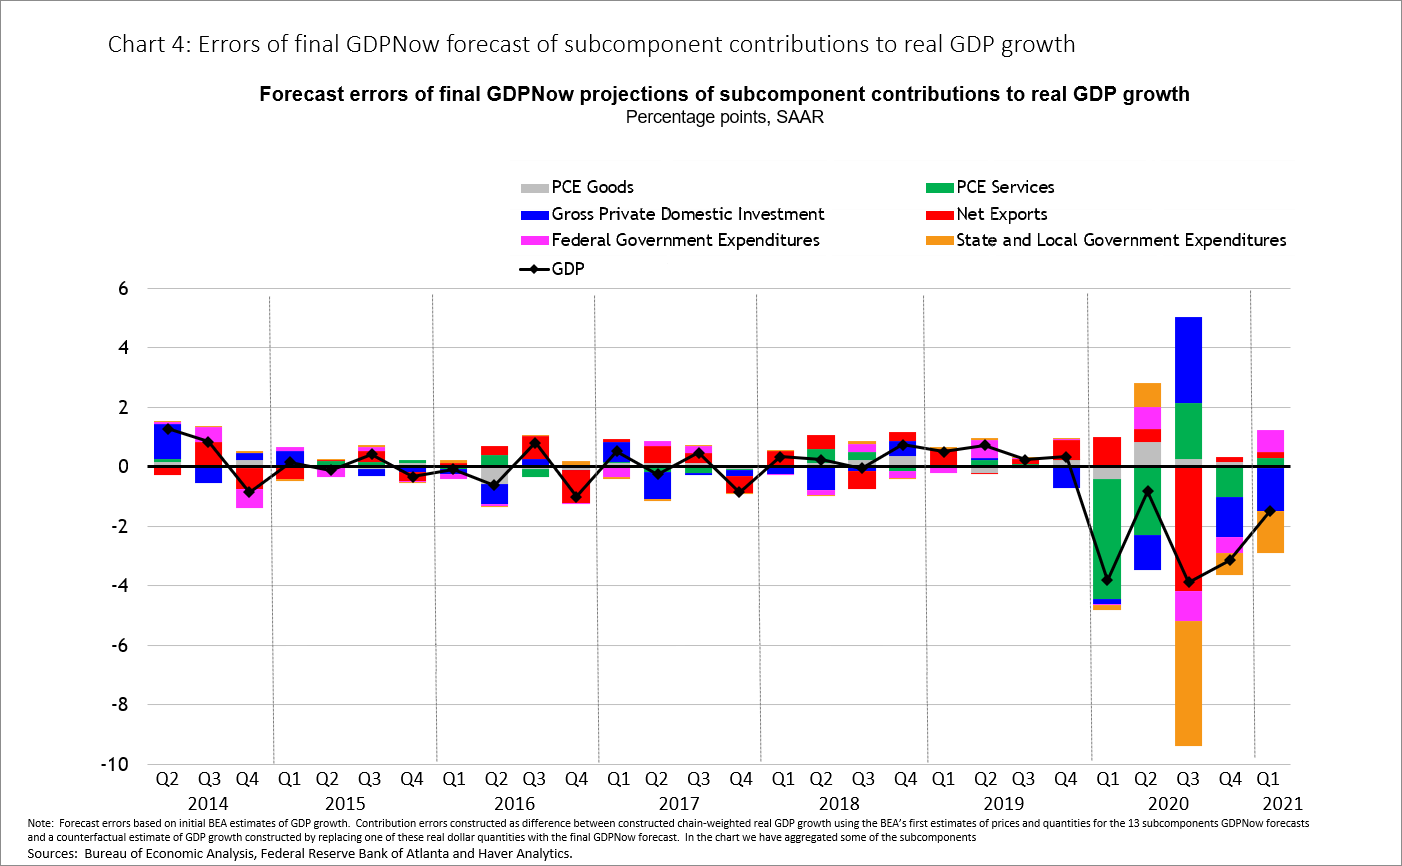
Still, it is plausible that the extreme fluctuations in the data used by the GDPNow model have embedded some inaccuracies into the GDPNow forecasts. To examine this question, let's consider GDPNow's final projections of the main subcomponent contributions to overall real GDP growth since the model was released to the public in 2014. Chart 4 shows the stacked forecast errors of these projections. By construction, the sum of the bars in any quarter is approximately equal to the black dot showing the difference between the first official estimate of real GDP growth and that quarter's final GDPNow forecast. The bars have become much larger since the pandemic, but especially for services consumption and state and local government expenditures (S&L). In this post, I've noted issues related to services consumption, but most of the huge third-quarter S&L error fell into a category referred to as "sales to other sectors ![]()
![]() ." GDPNow expected these sales—which are largely health, hospital, tuition, and other educational charges and fees—to continue plummeting in the third quarter instead of rebounding strongly, as they did. (The S&L contribution error is negative because the BEA subtracts these sales from the S&L subcomponent, and from GDP, to avoid double-counting). The S&L contribution errors in the last two quarters were still quite large, and mostly the result of the GDPNow model incorrectly continuing to forecast declines of these "sales to other sectors."
." GDPNow expected these sales—which are largely health, hospital, tuition, and other educational charges and fees—to continue plummeting in the third quarter instead of rebounding strongly, as they did. (The S&L contribution error is negative because the BEA subtracts these sales from the S&L subcomponent, and from GDP, to avoid double-counting). The S&L contribution errors in the last two quarters were still quite large, and mostly the result of the GDPNow model incorrectly continuing to forecast declines of these "sales to other sectors."
In the coming months, we plan to tweak the architecture behind GDPNow in hope of mitigating these sorts of errors. For instance, the day before the most recent GDP release, a modified version of the GDPNow model (one that reduces the influence of the pandemic on some of its forecasting equations) predicted first-quarter real GDP growth of 5.5 percent. More than half of the difference between this forecast and the official final GDPNow forecast of 7.9 percent growth was the result of a lower forecast for growth in the S&L subcomponent (1.3 percent), a number much closer to the BEA's S&L growth estimate (1.7 percent) than the final GDPNow forecast (14.6 percent). Such enhancements might help improve GDPNow's forecasting accuracy down the line. But GDPNow will remain susceptible to forecast inaccuracies whenever unusual events (such as the COVID-19 pandemic) hit the economy and dramatically shift spending patterns.

By Pat Higgins, a policy adviser and economist in the Atlanta Fed's Research Department