On April 28, the US Bureau of Economic Analysis reported that real gross domestic product (GDP) contracted an annualized rate of 1.4 percent last quarter. This decline "surprised" GDPNow, the Atlanta Fed's GDP tracking model, which had projected a 0.4 percentage point growth rate the day before the official release. Professional forecasters, who generally expected a rate around 1 percent based on economist surveys from Reuters![]() and the Wall Street Journal (WSJ)
and the Wall Street Journal (WSJ)![]() , also turned out to be overly optimistic.
, also turned out to be overly optimistic.
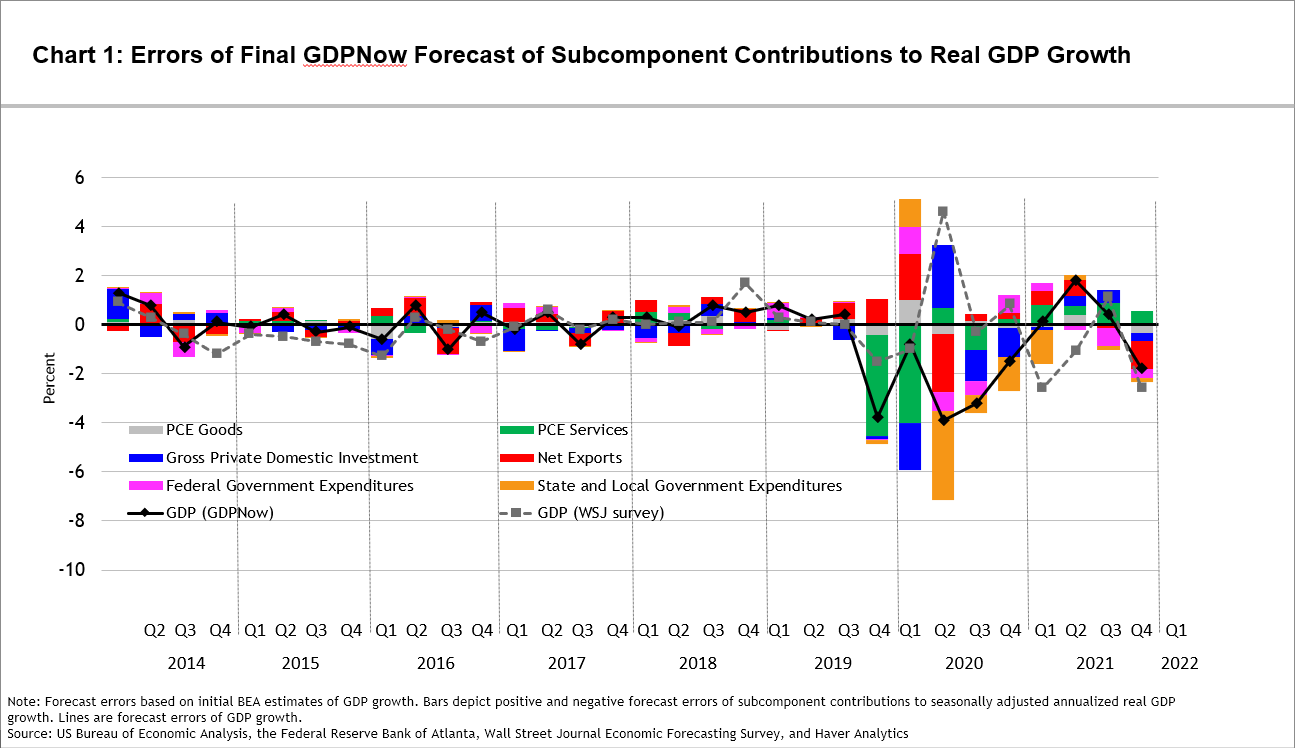
The lines in chart 1 represent errors for final forecasts of first-release estimates of real GDP growth from the WSJ Economic Forecasting Survey![]() and GDPNow. In the five-and-a-half years before the pandemic, the WSJ survey and GDPNow both had average absolute forecast errors—that is, without regard to sign, or mean absolute errors (MAEs)
and GDPNow. In the five-and-a-half years before the pandemic, the WSJ survey and GDPNow both had average absolute forecast errors—that is, without regard to sign, or mean absolute errors (MAEs)![]() —of about 0.5 percentage points. Since then, the MAEs have been 1.7 percent and 1.9 percent, respectively. The stacked bars in the chart represent a decomposition of the GDPNow line into forecast errors of subcomponent contributions to GDP growth. The chart makes it evident that the size of the bars has fallen since 2020, but continues to be larger than before the pandemic. Even GDPNow's relatively accurate forecasts for the second and fourth quarters of 2021 were largely the result of the positive and negative subcomponent errors fortuitously offsetting each other. GDPNow's error last quarter was largely concentrated in net exports. The model's final forecast of the growth rate of real final sales to private domestic purchasers—which excludes inventories and government spending in addition to net exports and has been shown to be a better leading indicator of one-quarter-ahead GDP growth than GDP growth itself is
—of about 0.5 percentage points. Since then, the MAEs have been 1.7 percent and 1.9 percent, respectively. The stacked bars in the chart represent a decomposition of the GDPNow line into forecast errors of subcomponent contributions to GDP growth. The chart makes it evident that the size of the bars has fallen since 2020, but continues to be larger than before the pandemic. Even GDPNow's relatively accurate forecasts for the second and fourth quarters of 2021 were largely the result of the positive and negative subcomponent errors fortuitously offsetting each other. GDPNow's error last quarter was largely concentrated in net exports. The model's final forecast of the growth rate of real final sales to private domestic purchasers—which excludes inventories and government spending in addition to net exports and has been shown to be a better leading indicator of one-quarter-ahead GDP growth than GDP growth itself is![]() —was only 0.3 percentage points below the initial estimate of 3.7 percent.
—was only 0.3 percentage points below the initial estimate of 3.7 percent.
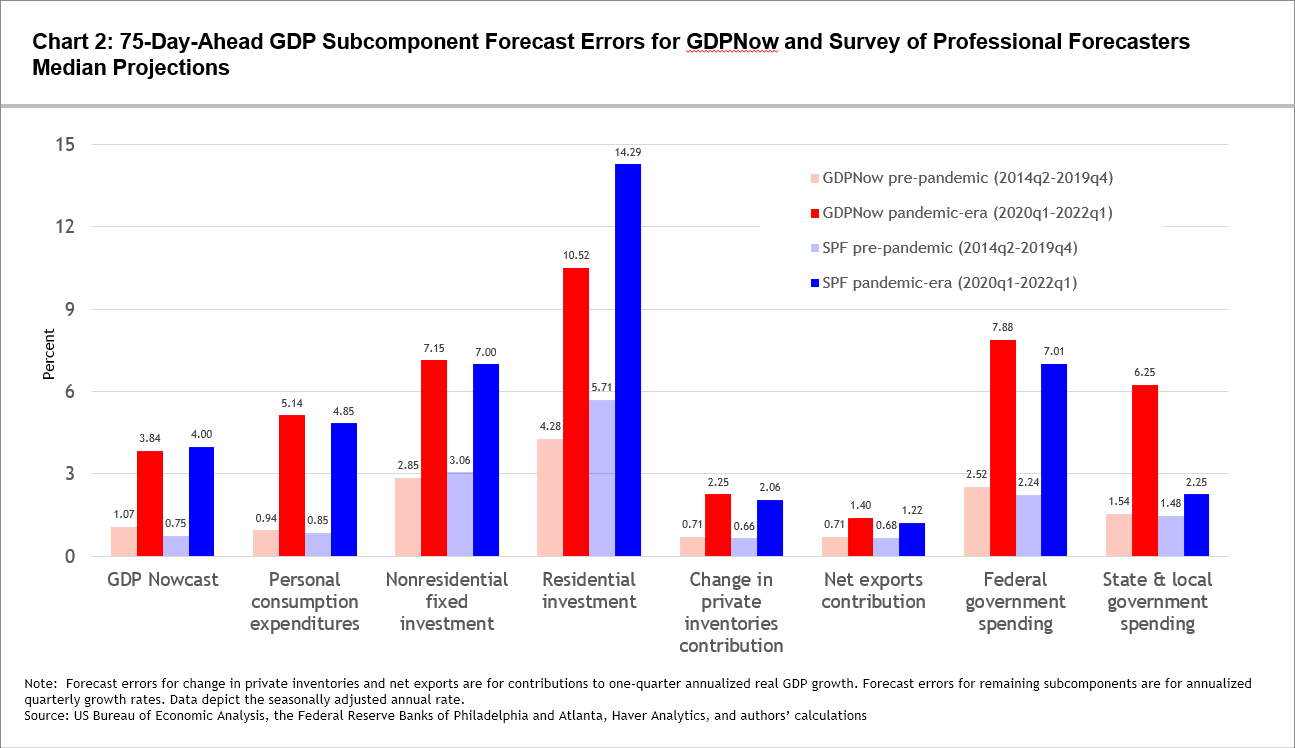
The deterioration in GDP forecasting accuracy during the pandemic has not been isolated to the shortest horizon projections. Chart 2 shows MAEs for roughly 75-day-ahead forecasts of growth rates of real GDP and its subcomponents (as well as net exports and inventory investment contributions to growth) from both GDPNow and the Philadelphia Fed's Survey of Professional Forecasters![]() (SPF). The decline in forecast accuracy for the SPF has been similar to the decline for GDPNow across subcomponents, with the exception of the state and local (S&L) government spending subcomponent, where the deterioration for GDPNow has been much starker. A Macroblog post from a year ago discussed the reasons for this.
(SPF). The decline in forecast accuracy for the SPF has been similar to the decline for GDPNow across subcomponents, with the exception of the state and local (S&L) government spending subcomponent, where the deterioration for GDPNow has been much starker. A Macroblog post from a year ago discussed the reasons for this.
The left-hand panel of chart 3 shows the MAEs for subcomponent contributions to GDP growth prior to the pandemic, and the right-hand panel shows contribution MAEs during the pandemic. Because the errors have been so much larger during the pandemic, the vertical axis is scaled to be six times larger in the right-hand panel than in the left-hand panel.
To show how forecast accuracy has evolved over a typical quarter, the figures in both panels of the charts begin with the MAE after the initial (roughly 90-day ahead) GDPNow forecast, end with the final GDPNow forecast, and use up to five other forecasts following particular data releases in between. Three of these releases are from the Institute of Supply Management's Manufacturing ISM Report On Business![]() (its manufacturing report, specifically) for each of the three months of the quarter being forecasted, and the other two correspond to the personal income and outlays
(its manufacturing report, specifically) for each of the three months of the quarter being forecasted, and the other two correspond to the personal income and outlays![]() releases from the US Bureau of Economic Analysis for the first two months of the quarter.
releases from the US Bureau of Economic Analysis for the first two months of the quarter.
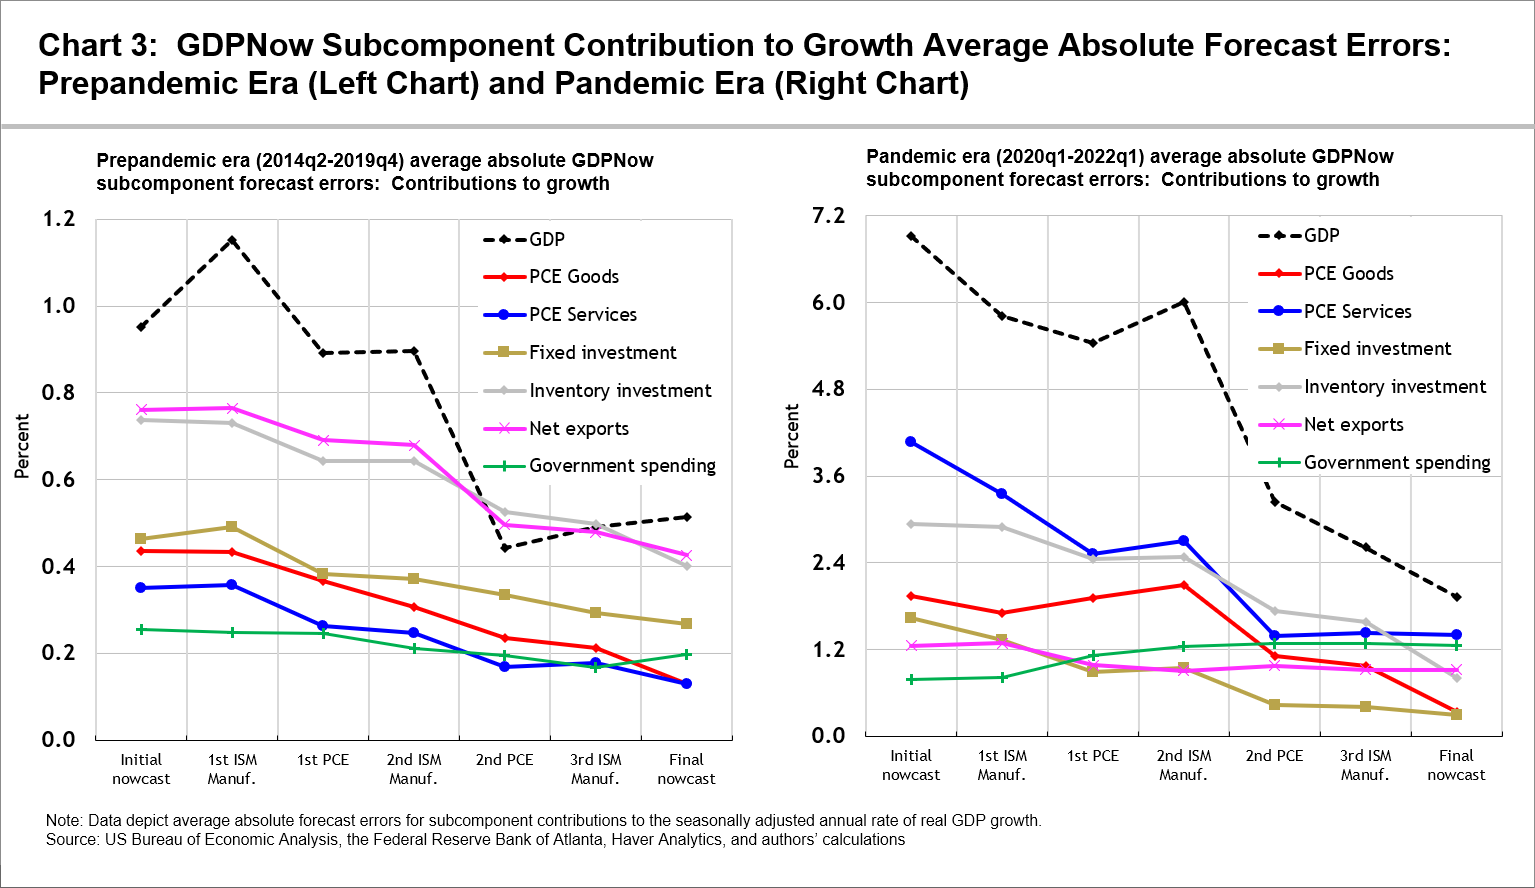
Notice that although both panels show the subcomponent projections generally becoming more accurate over time, the rank ordering of the subcomponent accuracy has changed in some nontrivial ways during the pandemic. In particular, even though personal consumption expenditures (PCE) on services account for 45 percent of nominal GDP, it was consistently one of the smaller sources of error prior to the pandemic. But during the pandemic, it has been one of the largest. Government spending was also one of the smaller sources of error prior to the pandemic and has remained that way during the early part of pandemic quarters. But this decade, the government spending forecasts have not tended to become more accurate as quarters have progressed, so that recently, just prior to the GDP release, government spending has been nearly as large a source of error as services PCE.
In the GDPNow model, the forecasts of government spending, particularly S&L government sales to other sectors, were distorted by the large swings in the second and third quarters of 2020. This documentation on recent changes made to the GDPNow model ![]() describes the changes made to keep these types of distortions to a minimum in the future, which is relevant to the data releases used in chart 3. Generally, a few days after the release of personal income and outlays data, the ISM releases its manufacturing data for the subsequent month, providing one of the first data snapshots for that month. The ISM data for this month are used to estimate the model's factor, that then feeds through to the forecasting equations for much of the yet-to-be-released monthly GDP source data.
describes the changes made to keep these types of distortions to a minimum in the future, which is relevant to the data releases used in chart 3. Generally, a few days after the release of personal income and outlays data, the ISM releases its manufacturing data for the subsequent month, providing one of the first data snapshots for that month. The ISM data for this month are used to estimate the model's factor, that then feeds through to the forecasting equations for much of the yet-to-be-released monthly GDP source data.
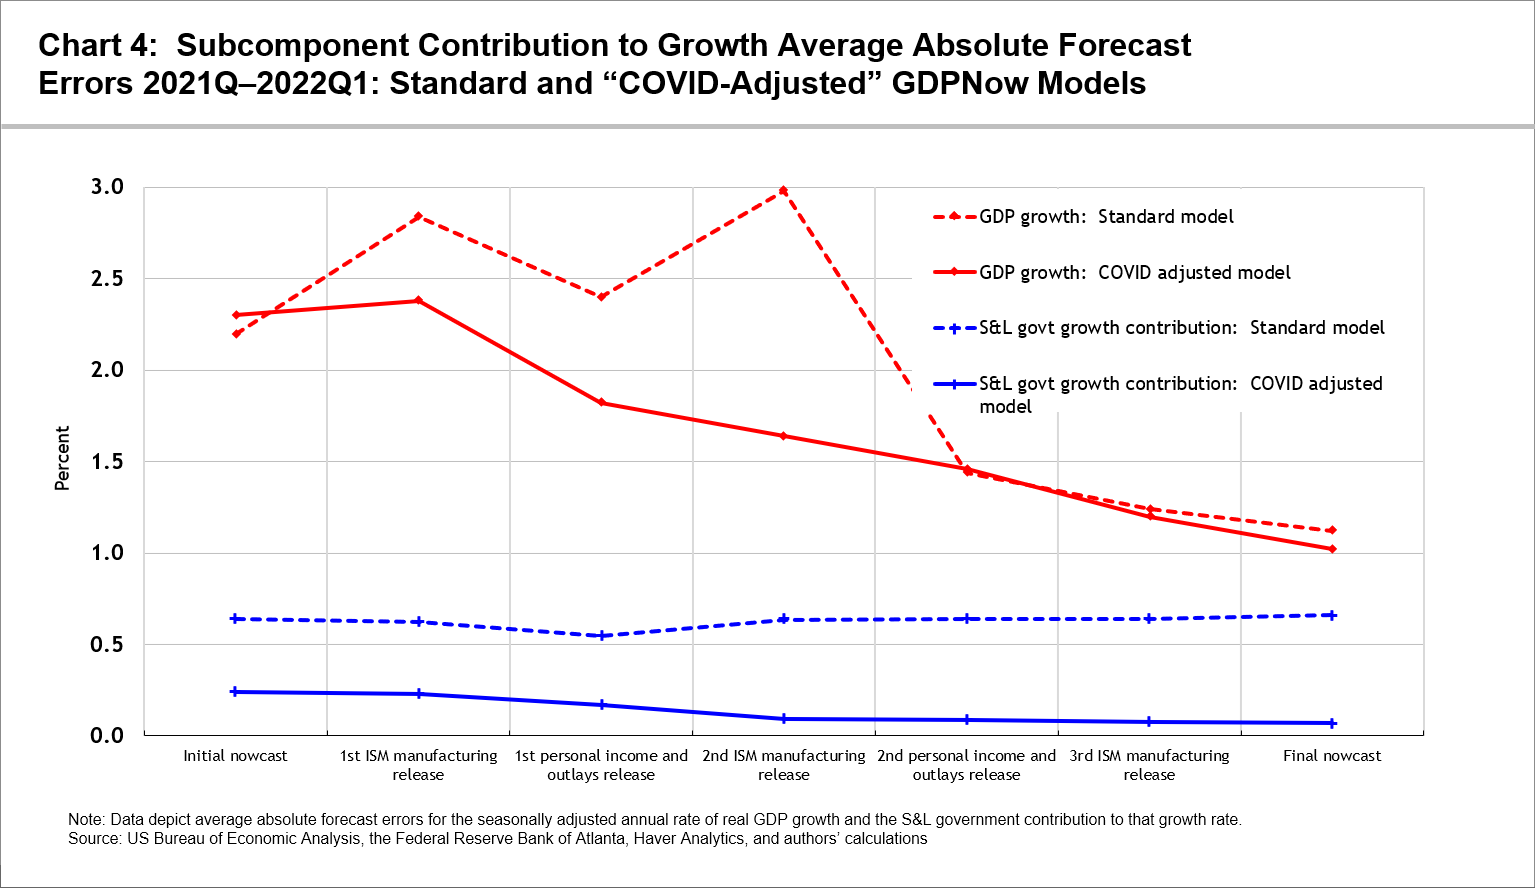
Chart 4 shows the MAE from the five quarters beginning in the first quarter of 2021 for real GDP growth and the S&L government contribution to GDP growth. The dashed lines are for the version of GDPNow that had been in use at the time, and the solid lines are for the "COVID-adjusted" model in use since the first quarter of 2022. (The same data releases used in chart 3 are used here.) The modified model shows a clear improvement in the forecasts of S&L government spending. Moreover, forecast accuracy no longer deteriorates following the release of the first-month and second-month ISM manufacturing releases. After the second personal income and outlays report of the quarter—and the final one before the initial GDP report—the accuracy and forecast values of the two models became more similar.
Although this is good news for improving the forecast accuracy of GDPNow, it is not clear whether near-term forecasts of GDP growth will continue to be less accurate than they were in the decade leading up to the pandemic. Ongoing geopolitical and economic uncertainties remain elevated, which could continue to have a negative impact on forecast accuracy for some time to come.

By Pat Higgins, a policy adviser and economist, and