People in monetary policy circles sometimes use the phrase "long and variable lags" to describe the delayed impact of the Fed's main policy tool on demand and inflation. The popularization of that phrase can be traced to a speech by Milton Friedman during the 1971 American Economic Association meetings, and since then people usually use it to describe the impact of Fed policy on economic output and inflation. Yet, during that speech, when summing up his work on the subject, he noted that "...monetary changes take much longer to affect prices than to affect output," adding that the maximum impact on prices is not apparent for about one and a half to two years.
Since Milton Friedman, many economists have studied these "long and variable lags" (including former Fed chair Ben Bernanke). And, while the length of the lag has proven "variable" as first suggested, the main result still rings true. Changes in the stance of monetary policy have the largest impact on output first and then, much later, on inflation. A large literature bears out this assertion. Bernanke et al. (1999) and Christiano, Eichenbaum, and Evans (2005) point to a two-year lag between monetary policy actions and their main effect on inflation. Gerlach and Svensson (2001) report an approximately 18-month lag in the euro area, while Batini and Nelson (2001) estimate that changes in the money supply have their peak impact on inflation in the UK after a year.
That context is especially useful for monetary policymakers to keep in mind as they navigate the economic challenges of the pandemic. In a span of just two and a half years, the US economy has suffered its sharpest post-WWII decline in economic output, a subsequent rapid resurgence in demand, a dramatic disconnect between labor supply and labor demand, widespread supply and shipping constraints, and an inflation rate that has surged from roughly 1.5 percent to 9 percent in the past 17 months. And, despite current strong job growth and the highest inflation this country has seen in 40 years, worries over a potential recession mount (as evidenced by the number of questions Chair Powell was asked about the "r word" in his press conference ![]()
![]() following the most recent meeting of the Federal Open Market Committee). These beliefs partly reflect the rapid shift in the fiscal and monetary policy stance over the past year. In response to the pandemic, Congress approved a stimulus package of $5 trillion
following the most recent meeting of the Federal Open Market Committee). These beliefs partly reflect the rapid shift in the fiscal and monetary policy stance over the past year. In response to the pandemic, Congress approved a stimulus package of $5 trillion![]() , while the Fed expanded its balance sheet by roughly the same amount. But now, the federal deficit has fallen more than 81 percent
, while the Fed expanded its balance sheet by roughly the same amount. But now, the federal deficit has fallen more than 81 percent![]() in first 10 months of 2022 fiscal year compared to 2021. In turn, the Fed has embarked on policy normalization, raising interest rates well into the range of neutral and drawing down its balance sheet (actions known as quantitative tightening).
in first 10 months of 2022 fiscal year compared to 2021. In turn, the Fed has embarked on policy normalization, raising interest rates well into the range of neutral and drawing down its balance sheet (actions known as quantitative tightening).
Although "this time is different," we might be able to gain insights into the appropriate path of monetary policy by revisiting the past. At the time of Milton Friedman's 1971 speech, the economy was coming out of what many economists saw as a policy-driven recession![]() , which followed a period of fiscal tightening to make up for large government outlays for the Vietnam War and a sizeable slowing in money growth as the Fed attempted to quell rising inflation. Today, the main policy tool is the federal funds rate, but prior to the early 1980s, changes in the money supply were the primary instrument. (Monetary aggregates—that is, growth in the money supply—formally replaced bank credit as the primary intermediate target of monetary policy in 1970. At the time, the fed funds rate played only a secondary role and was used as guideline in day-to-day open market operations, aimed at smoothing short run volatility.) In the run-up to the 1969–70 recession, the Fed tightened policy, slowing the growth in the money supply from 8 percent on a year-over-year basis to just 2 percent (the associated increase in the fed funds rate was roughly 4.5 percentage points, to 9 percent). Yet, as quickly as the Federal Open Market Committee tightened policy in the late 1960s, it more than reversed course in response to a sizeable increase in the unemployment rate during the recession. By late 1971, the money supply was surging again, up 13 percent on a year-over-year basis.
, which followed a period of fiscal tightening to make up for large government outlays for the Vietnam War and a sizeable slowing in money growth as the Fed attempted to quell rising inflation. Today, the main policy tool is the federal funds rate, but prior to the early 1980s, changes in the money supply were the primary instrument. (Monetary aggregates—that is, growth in the money supply—formally replaced bank credit as the primary intermediate target of monetary policy in 1970. At the time, the fed funds rate played only a secondary role and was used as guideline in day-to-day open market operations, aimed at smoothing short run volatility.) In the run-up to the 1969–70 recession, the Fed tightened policy, slowing the growth in the money supply from 8 percent on a year-over-year basis to just 2 percent (the associated increase in the fed funds rate was roughly 4.5 percentage points, to 9 percent). Yet, as quickly as the Federal Open Market Committee tightened policy in the late 1960s, it more than reversed course in response to a sizeable increase in the unemployment rate during the recession. By late 1971, the money supply was surging again, up 13 percent on a year-over-year basis.
The Fed's quick and stark policy reversal became a recurring theme in the 1970s. During the decade, the Fed quickly pivoted between battling high unemployment and high inflation, what many economists refer to as "stop-and-go" policies![]() . Charts 1 and 2 clearly show these shifting stances as they occurred again in the run-up to and aftermath of the 1974–75 recession. Chart 1 plots the year-over-year growth rate in the money supply (M2) and the unemployment rate, and chart 2 plots the growth in the money supply against the year-over-year growth rate in consumer price index inflation.
. Charts 1 and 2 clearly show these shifting stances as they occurred again in the run-up to and aftermath of the 1974–75 recession. Chart 1 plots the year-over-year growth rate in the money supply (M2) and the unemployment rate, and chart 2 plots the growth in the money supply against the year-over-year growth rate in consumer price index inflation.
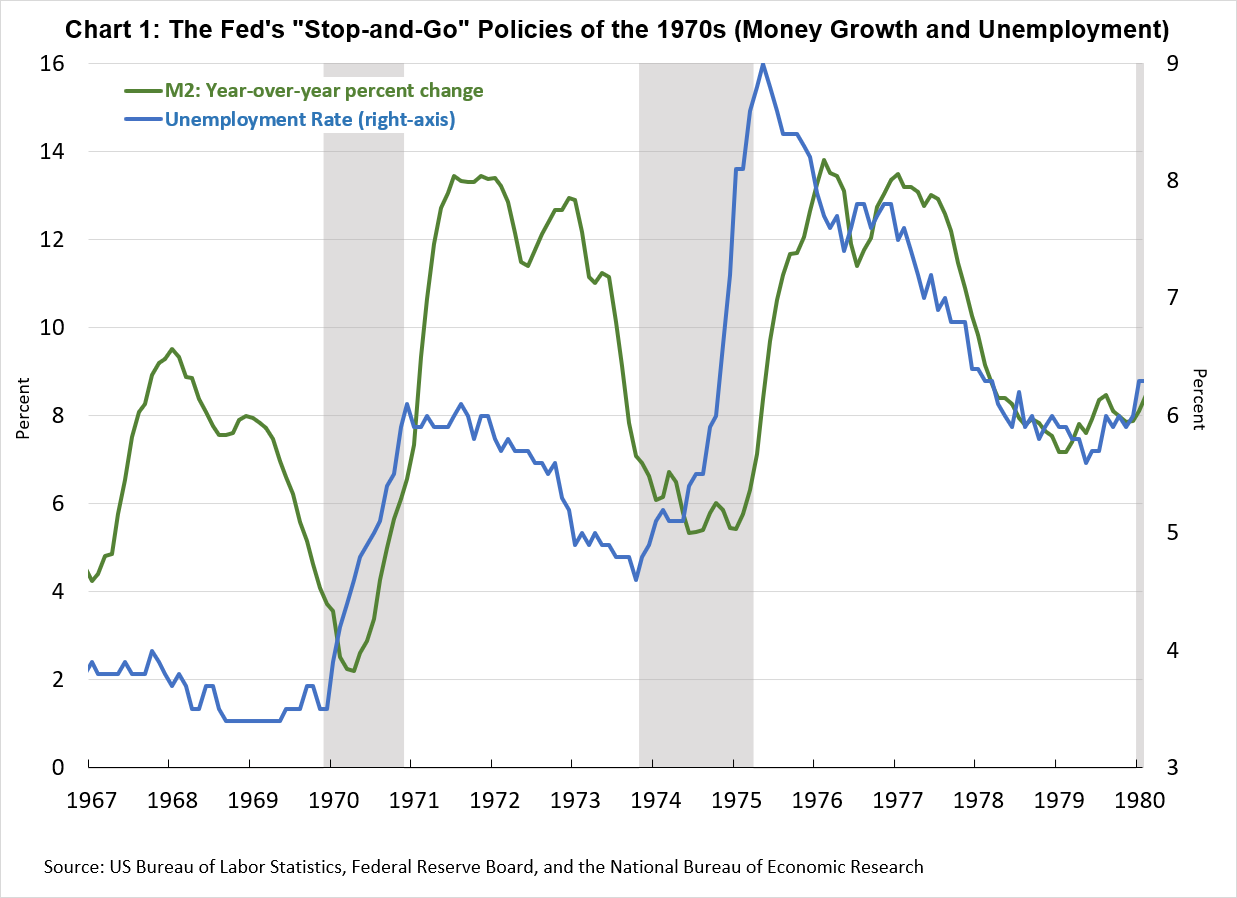
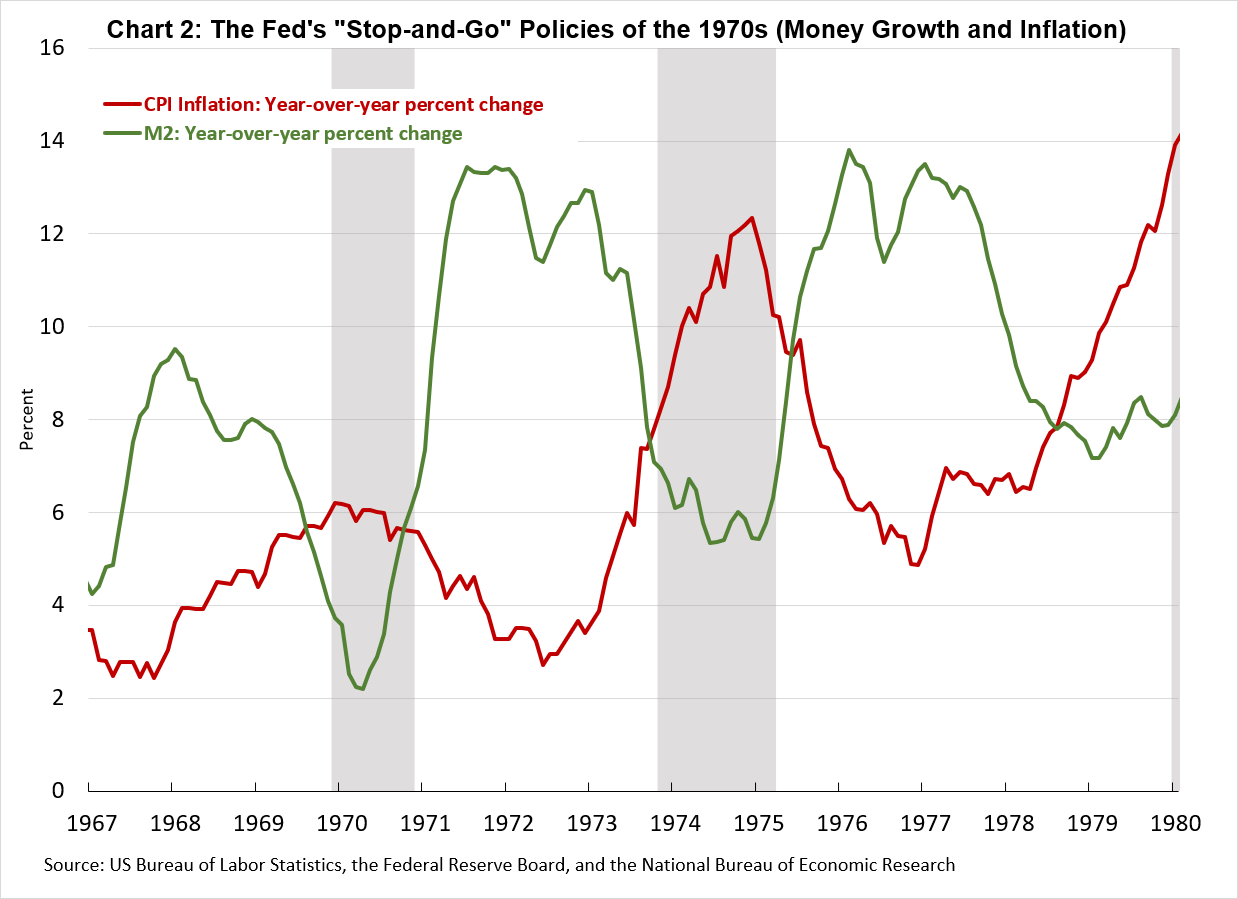
These charts depict three points that remain salient today. First, the "stop-and-go" policies of the 1970s clearly highlight the "long and variable lags" that changes in monetary policy have on inflation. Money growth plateaus at high levels three times during the late 1960s through the 1970s: in 1968, 1972, and in the mid-1970s. Each of those periods is followed by a subsequent surge in inflation, prompting a sustained tightening of monetary conditions. But as soon as inflation began falling, the Fed quickly reversed course with a bold expansion in the money supply that overshadowed the one originating the previous cycle, citing spikes in unemployment along with a lagged decline in inflation as justifications for these reversals.
If we smooth through some of the cyclical dynamics, there was a sustained upward drift in both the unemployment rate and inflation. In the mid-1960s, both inflation and the unemployment rate were around 2 percent. And 1980 inflation was over 10 percent and the unemployment rate had drifted up to 6 percent.
This period's upward drift in unemployment and inflation ran counter to the era's prevailing wisdom, which held that higher inflation was simply the sacrifice needed to lower the unemployment rate, and vice versa, An insightful essay![]() by former Atlanta Fed economist Mike Bryan covers this period in depth. He writes, "The stable trade-off between inflation and unemployment proved unstable. The ability of policymakers to control any ‘real' variable was ephemeral. This truth included the rate of unemployment, which oscillated around its ‘natural' rate. The trade-off that policymakers hoped to exploit did not exist."
by former Atlanta Fed economist Mike Bryan covers this period in depth. He writes, "The stable trade-off between inflation and unemployment proved unstable. The ability of policymakers to control any ‘real' variable was ephemeral. This truth included the rate of unemployment, which oscillated around its ‘natural' rate. The trade-off that policymakers hoped to exploit did not exist."
Why didn't this stable tradeoff exist? Part of the answer is that the unemployment rate fluctuates around an unobserved natural rate. (Fed chair Jerome Powell's 2018 speech![]() offers an accessible discussion of these unobservables.) But the other part of the answer that is particularly salient at the moment is that by the mid- to late 1970s, after enduring a sustained period of rising unemployment and inflation, people began to expect higher inflation rates.
offers an accessible discussion of these unobservables.) But the other part of the answer that is particularly salient at the moment is that by the mid- to late 1970s, after enduring a sustained period of rising unemployment and inflation, people began to expect higher inflation rates.
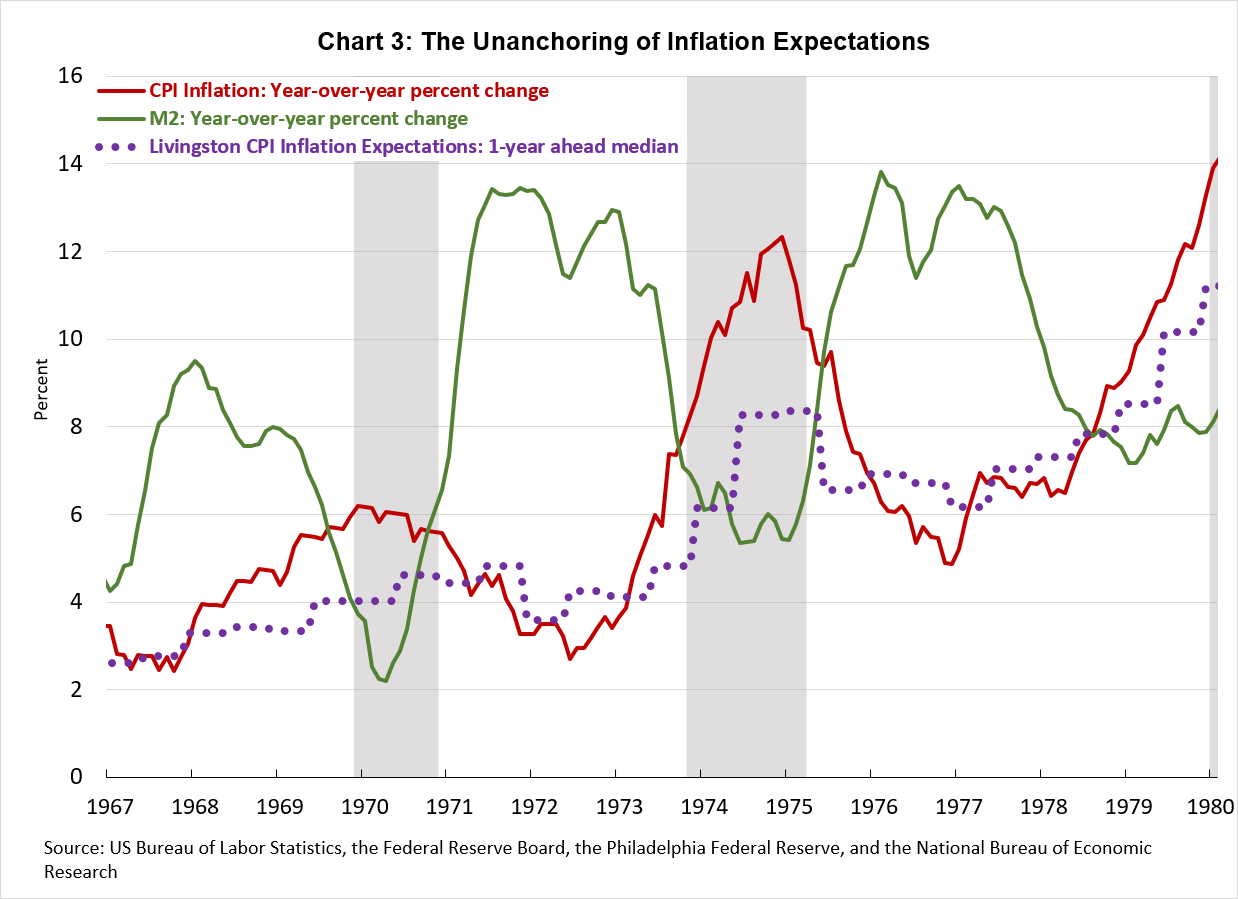
Chart 3 plots one-year-ahead inflation expectations alongside inflation and money growth using data from the Livingston Survey![]() , a twice-annual survey of a small group of professional economists that the Philadelphia Fed has conducted since the end of WWII. And here the upward drift in inflation expectations is striking. By 1980, inflation expectations had risen 10 percent. Our interpretation of these data is that the rapid reversals of policy that characterized Fed actions during the 1970s never allowed inflation to fall back to the 1 to 3 percent range that was the norm after the end of the Korean War. As a consequence, the expectation that inflation would not recede into the background eventually became embedded into the psyche of Americans. People who lived through this experience simply anticipated higher future inflation rates, with that expectation embedded into their price-setting and wage-bargaining decisions.
, a twice-annual survey of a small group of professional economists that the Philadelphia Fed has conducted since the end of WWII. And here the upward drift in inflation expectations is striking. By 1980, inflation expectations had risen 10 percent. Our interpretation of these data is that the rapid reversals of policy that characterized Fed actions during the 1970s never allowed inflation to fall back to the 1 to 3 percent range that was the norm after the end of the Korean War. As a consequence, the expectation that inflation would not recede into the background eventually became embedded into the psyche of Americans. People who lived through this experience simply anticipated higher future inflation rates, with that expectation embedded into their price-setting and wage-bargaining decisions.
Now, history here is messy. A number of caveats and confounding factors contributed to the unfavorable economic outcomes of the 1970s. Fed historians such as Allan Meltzer argue that the prevailing Fed chair at the time, Arthur Burns, did not consider monetary policy as ultimately responsible for such high inflation. Instead, the chair pointed to unions' wage-bargaining power first and, in particular, "cost-push" shocks (that is, energy and food shortages) later as the responsible party. (And indeed, this "cost-push" theory of inflation, so prevalent at the time, merits further exploration since assuming that spikes in energy prices might have contributed to the unanchoring of inflation expectations makes sense.)
Yet, in the case of oil price shocks, there is a counterpoint. The breakdown of the Bretton Woods accords ultimately drove the sustained increase in oil prices, and their breakdown can be seen in the era's robust money growth at the time. The breakdown of these accords created a run on the dollar amid fears of inflation. The price of gold took off as many investors were scrambling for an inflation hedge. Interestingly, the increase in the price of oil actually followed the spike in the price of gold and other commodities.
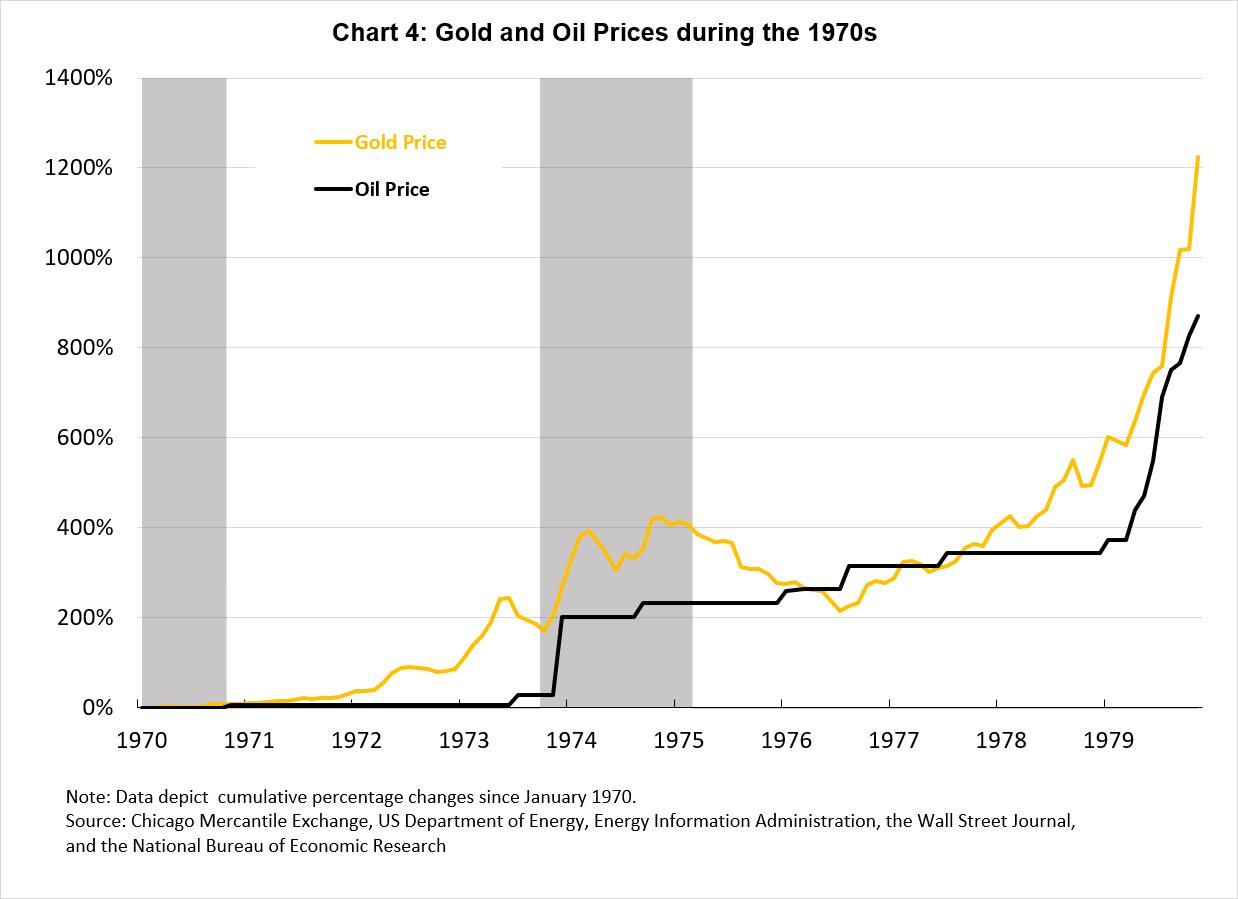
The historical evidence suggests that by 1970, the attempt to defend the dollar at a fixed peg of $35 per ounce, established by the Bretton Woods agreements, had become increasingly untenable, and gold outflows from the United States accelerated amid sustained inflation and trade/fiscal deficits. The run on the dollar forced President Nixon to effectively "close the gold window," making the dollar inconvertible to gold in August 1971. One month later, OPEC communicated![]() its intention to price oil in terms of a fixed amount of gold. Hence, the increase in the money supply, spurred by the run-up in gold prices, exacerbated the increase in the dollar price of oil and led to the high inflation that followed. OPEC was slow to readjust prices to reflect this depreciation. However, the substantial price increases of 1973–74 and 1979 largely returned oil prices to the corresponding gold parity (see chart 4), which, again, was then seen as an inflation hedge.
its intention to price oil in terms of a fixed amount of gold. Hence, the increase in the money supply, spurred by the run-up in gold prices, exacerbated the increase in the dollar price of oil and led to the high inflation that followed. OPEC was slow to readjust prices to reflect this depreciation. However, the substantial price increases of 1973–74 and 1979 largely returned oil prices to the corresponding gold parity (see chart 4), which, again, was then seen as an inflation hedge.
In this context, it's worth noting that the OPEC oil embargo following the Yom Kippur War![]() lasted just a few months, but the price increase was permanent. Similarly, the drop in oil production following the Iranian Revolution was negligible, as Saudi Arabia increased production to offset most of the decline. Contrast these episodes to the Gulf War in 1990. Oil prices doubled during the conflict (July–October) but went back to previous levels once the war ended.
lasted just a few months, but the price increase was permanent. Similarly, the drop in oil production following the Iranian Revolution was negligible, as Saudi Arabia increased production to offset most of the decline. Contrast these episodes to the Gulf War in 1990. Oil prices doubled during the conflict (July–October) but went back to previous levels once the war ended.
In sum, Arthur Burns leaned heavily into the notion that these cost-push shocks—and not Fed action—were ultimately responsible for inflation, effectively ignored the "long and variable" lags of monetary policy, misread the monetary dynamics, and reacted expediently to the real-side damage that high energy prices wreaked on the economy.
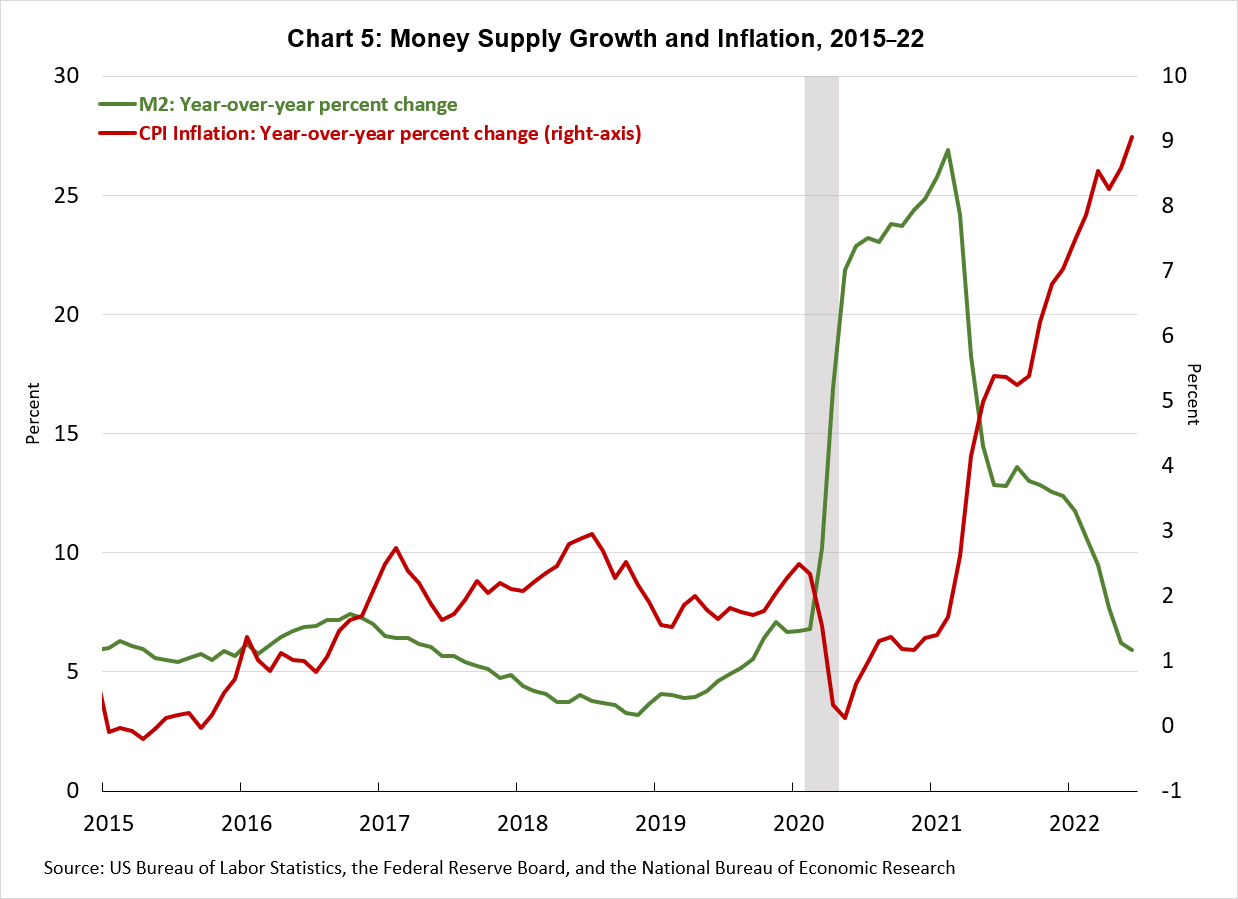
So let's fast-forward to today. The fiscal response to the onset of the pandemic was quite forceful—$5 trillion by most counts![]() —and at least on par with significant wartime spending. As these transfers and disbursements hit households' wallets and businesses' ledgers, money growth surged higher than 25 percent—peaking well above, though not as sustained as, the high money-growth periods during the 1970s (see chart 5). And we've seen a sharp surge in inflation that has gone well beyond pandemic-related supply constraints and shipping bottlenecks that affected certain production inputs such as computer chips. As of July 2022, roughly three-quarters of consumers' market basket rose at rates in excess of 3 percent (and two-thirds of the market basket increased at rates north of 5 percent). These levels are on par with those we saw during the Great Inflation of the 1970s.
—and at least on par with significant wartime spending. As these transfers and disbursements hit households' wallets and businesses' ledgers, money growth surged higher than 25 percent—peaking well above, though not as sustained as, the high money-growth periods during the 1970s (see chart 5). And we've seen a sharp surge in inflation that has gone well beyond pandemic-related supply constraints and shipping bottlenecks that affected certain production inputs such as computer chips. As of July 2022, roughly three-quarters of consumers' market basket rose at rates in excess of 3 percent (and two-thirds of the market basket increased at rates north of 5 percent). These levels are on par with those we saw during the Great Inflation of the 1970s.
The Committee has begun an aggressive campaign to squelch this inflation threat, hiking rates in each of the last four meetings by a cumulative 2 percentage points along with implementing plans to reduce the size of the Federal Reserve's balance sheet. It has also indicated that more policy tightening is to come![]() . If history is any guide, at least in broad strokes, it will take some time before recent policy actions begin to affect inflation.
. If history is any guide, at least in broad strokes, it will take some time before recent policy actions begin to affect inflation.
And here, it appears that the FOMC is very attuned to the lessons from the Great Inflation period. In a recent speech at Jackson Hole![]() , Chair Powell noted, "Our monetary policy deliberations and decisions build on what we have learned about inflation dynamics both from the high and volatile inflation of the 1970s and 1980s, and from the low and stable inflation of the past quarter-century." Perhaps more importantly, he emphasized, "Restoring price stability will likely require maintaining a restrictive policy stance for some time. The historical record cautions strongly against prematurely loosening policy."
, Chair Powell noted, "Our monetary policy deliberations and decisions build on what we have learned about inflation dynamics both from the high and volatile inflation of the 1970s and 1980s, and from the low and stable inflation of the past quarter-century." Perhaps more importantly, he emphasized, "Restoring price stability will likely require maintaining a restrictive policy stance for some time. The historical record cautions strongly against prematurely loosening policy."

By Federico Mandelman, research economist and adviser, and

By Brent Meyer, assistant vice president and economist, both in the Atlanta Fed’s Research Department