In many markets, economists' best measure of fluctuations in supply and demand is the price: the classic intersecting-curves logic suggests that when demand starts outstripping supply, the price rises. But labor markets are not always conducive to this approach because of how variegated labor is and because of the difficulty of matching workers with openings. Instead, economists often try to measure what's termed "tightness," which is essentially the ratio of labor demand to labor supply, or job openings to job seekers. In the recovery from the pandemic, following convulsions in both supply and demand, monitoring the labor market tightness has taken new import. Indeed, in his speech![]() at Jackson Hole, Fed chair Jerome Powell said labor market tightness would factor into policy decisions:
at Jackson Hole, Fed chair Jerome Powell said labor market tightness would factor into policy decisions:
"Evidence that the tightness in the labor market is no longer easing could also call for a monetary policy response," he said in those remarks.
In this Policy Hub: Macroblog post, we want to discuss both how to measure labor market tightness and how it has been evolving in recent months. Measures of labor market tightness can be both direct or indirect. The US Bureau of Labor Statistics has a direct measure of the number of open jobs with its Job Openings and Labor Turnover Survey (JOLTS), and other measures come from private-sector firms that track the number of job ads. Although ads are not a perfect measurement because an opening might not be advertised or an ad might represent multiple openings, there is a fairly stable relationship, and many of the firms using ad counts benchmark their indices to JOLTS.
However, the other side, labor supply, is less easily measured. Although the official unemployment pool is a proxy for searchers—they are identified by actively looking for work—this is incomplete because employed workers or nonparticipants fill the majority of jobs. If the supply of job seekers who aren't in the unemployment pool was proportional to the unemployment pool, there would not be an issue, but there is ample evidence this such proportionality doesn’t exist. Hence, a first step toward measuring tightness is the ratio of vacancies to job seekers, taking seekers as the unemployed: ![]() . But it is an imperfect measure.
. But it is an imperfect measure.
Indirect measures of tightness, on the other hand, look at how quickly job openings fill and how quickly job seekers find new jobs. In a tight market, openings should fill more slowly and seekers should find jobs more quickly. To systematize this logic, economists use a matching function, where the number of new matches is a function of job openings ![]() and job seekers
and job seekers ![]() . Then the probability an opening is filled by a new hire is
. Then the probability an opening is filled by a new hire is ![]() and the probability a searcher finds a new job is
and the probability a searcher finds a new job is ![]() . With some mathematical restrictions on the function
. With some mathematical restrictions on the function ![]() these fractions can be rewritten as functions of tightness,
these fractions can be rewritten as functions of tightness, ![]() 1. It is then just a matter of measuring the hiring rate per opening,
1. It is then just a matter of measuring the hiring rate per opening, ![]() , or the finding rate per seeker,
, or the finding rate per seeker, ![]() , and inverting the functional relationship between those measures and tightness
, and inverting the functional relationship between those measures and tightness ![]() .
.
JOLTS gives us both the number of new hires by firms and the number of job openings, so we can directly measure ![]() , the hiring rate. However, we should note that there is some inconsistency here, especially during the pandemic, highlighted by Hall and Kudlyak
, the hiring rate. However, we should note that there is some inconsistency here, especially during the pandemic, highlighted by Hall and Kudlyak ![]()
![]() (2022) since hires include recall hires but openings do not. Using our functional form assumptions on the matching function
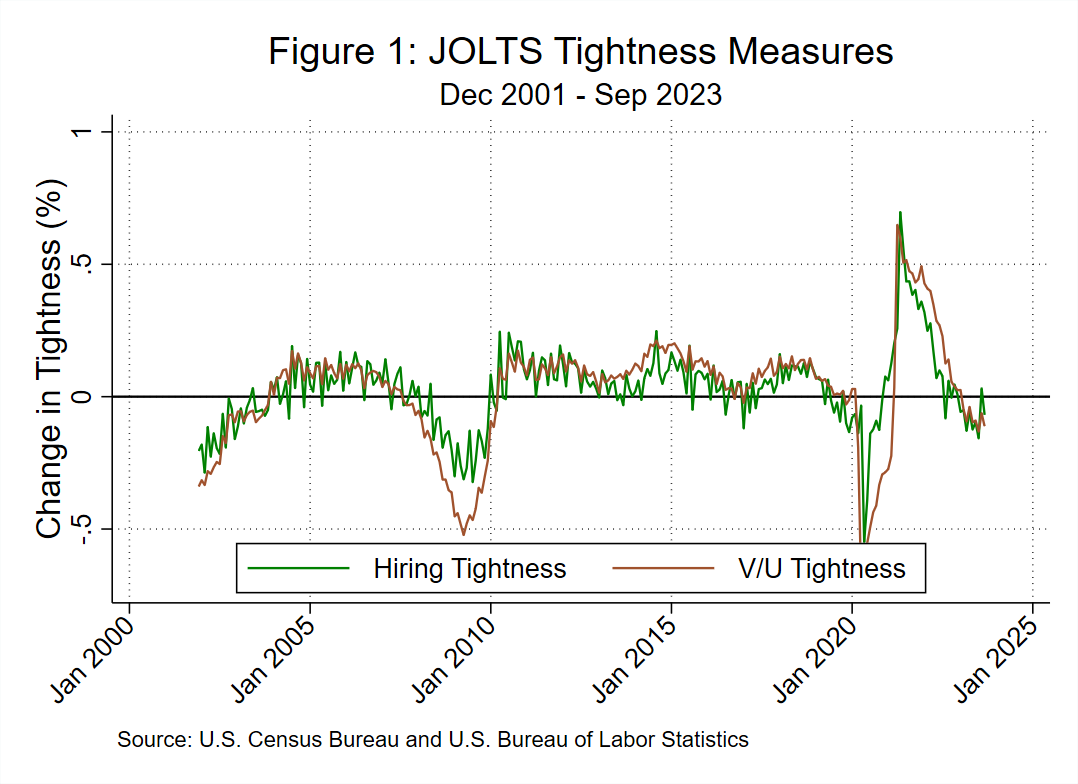
(2022) since hires include recall hires but openings do not. Using our functional form assumptions on the matching function ![]() , we can then back-out tightness, which we call hiring-based tightness. Figure 1 pairs that with the other, directly measured tightness
, we can then back-out tightness, which we call hiring-based tightness. Figure 1 pairs that with the other, directly measured tightness ![]() , using
, using ![]() from JOLTS and
from JOLTS and ![]() as the unemployment level from the Current Population Survey (CPS). We plot the year-over-year percentage change and see how both measures imply that tightness has been declining since early 2023. Looking early in the pandemic, we see that the two measures are clearly not exactly the same, as directly measured tightness shows large swings primarily from the large changes in
as the unemployment level from the Current Population Survey (CPS). We plot the year-over-year percentage change and see how both measures imply that tightness has been declining since early 2023. Looking early in the pandemic, we see that the two measures are clearly not exactly the same, as directly measured tightness shows large swings primarily from the large changes in ![]() in 2020. At this stage in the recovery, however, both are showing a gradual decline.
in 2020. At this stage in the recovery, however, both are showing a gradual decline.
Alternatively, we can measure tightness indirectly by looking at supply-side measures of labor from the CPS. We measure how likely an unemployed or employed searcher is to find a job and again invert our matching function to infer tightness. These measures are not using a count of ![]() . Instead, we infer that if a searching worker finds a job more quickly, it must mean that more openings are available. As mentioned, job seekers might be either the official unemployment pool, or they might come from the already employed. Assuming job seekers are unemployed, our
. Instead, we infer that if a searching worker finds a job more quickly, it must mean that more openings are available. As mentioned, job seekers might be either the official unemployment pool, or they might come from the already employed. Assuming job seekers are unemployed, our ![]() measure is the number of newly hired unemployed, per unemployed person (typically called UE tightness). We compute the same fraction for employed, new matches of employed workers per employed worker (EE tightness). Fujita, Moscarini, and Postel-Vinay
measure is the number of newly hired unemployed, per unemployed person (typically called UE tightness). We compute the same fraction for employed, new matches of employed workers per employed worker (EE tightness). Fujita, Moscarini, and Postel-Vinay![]() (2022) introduce an important challenge to the measurement of job-finding by employed workers, so we take their adjusted statistics rather than those directly measured by the CPS. Figure 2 shows the year-over-year change in tightness implied by both measures. Aside from a small deviation of tightness measured by the employed's job finding and a recent uptick in the tightness measured by the unemployed's job finding, both CPS measures have consistently decreased since the start of the year.
(2022) introduce an important challenge to the measurement of job-finding by employed workers, so we take their adjusted statistics rather than those directly measured by the CPS. Figure 2 shows the year-over-year change in tightness implied by both measures. Aside from a small deviation of tightness measured by the employed's job finding and a recent uptick in the tightness measured by the unemployed's job finding, both CPS measures have consistently decreased since the start of the year.
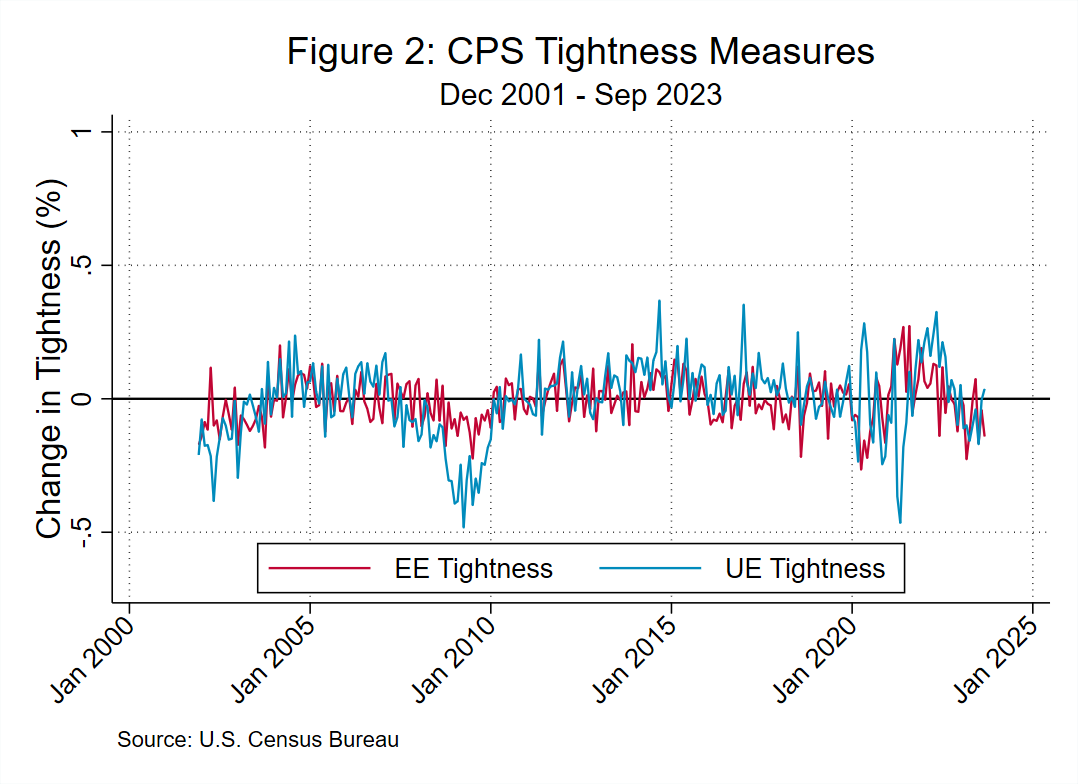
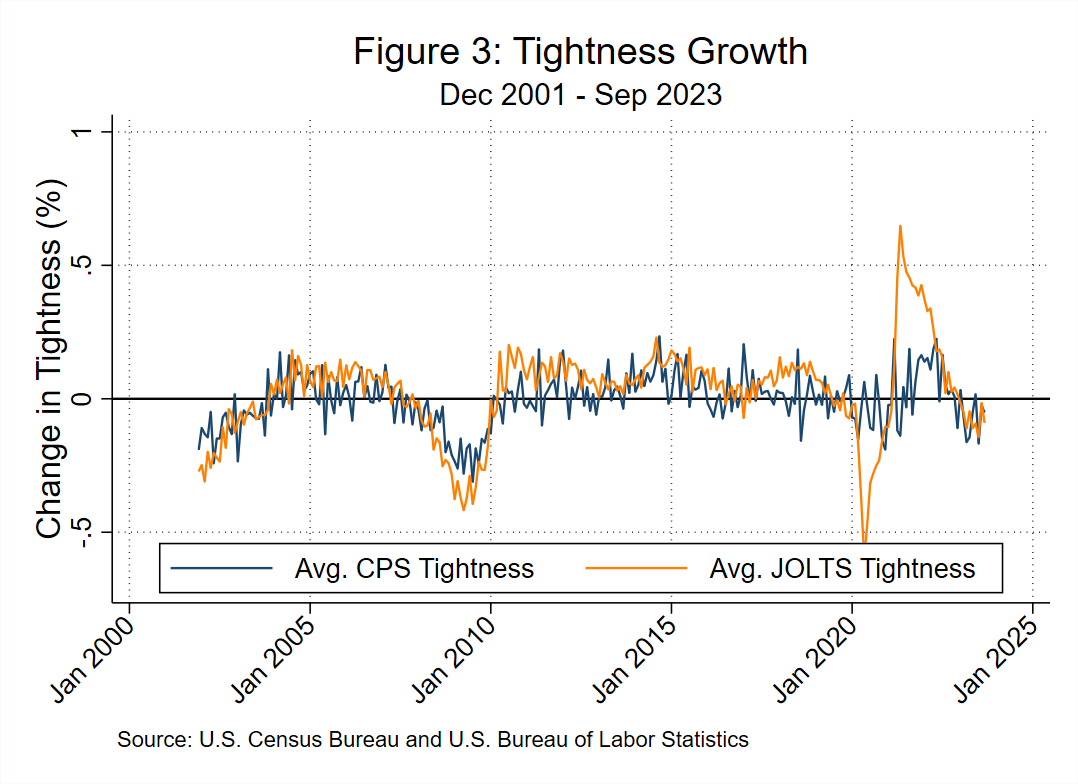
Figure 3 averages the measures obtained from the CPS and JOLTS data for comparison. Early in the pandemic and the ensuing recovery, these CPS-derived measures are quite different from the JOLTS-derived ones. Indeed, measures derived from job-finding rates showed much smaller swings, emphasizing the usefulness of measuring the same economic concept from different angles. At this stage, long into the recovery, our CPS-derived measures are again showing trends similar to the others.
These four independently generated measures of tightness have the same message about the current moment: the labor market is cooling, as it often does when the business cycle is slowing. This cooling is a marked contrast with the experience early in the recovery, when the labor market was unprecedentedly tight, and demand increased more rapidly than labor supply by nearly every measure. This trend has now reversed, and it is starting to decline. But the fact that tightness is decreasing doesn’t mean that the labor market is not quite hot in some regard. We see a labor market where firms still have a tougher-than-normal time finding workers, and workers looking for jobs are getting them more quickly, but both measures are worsening.
Coming back to Chair Powell's comments, if tightness enters into Fed decisions, then by any measure it is still easing. But why should the Fed respond to tightness? After all, it’s a measure that is not an explicit component of the Fed's dual mandate. The most direct way that labor market tightness matters is by affecting the ability of workers to find jobs, and when the market is very tight, the job finding rate is high, which puts downward pressure on unemployment. Although the labor market is getting less tight, it has not yet adversely affected the full-employment portion of the mandate, as unemployment is still historically low. Tightness might also feed into inflation because, in competing over workers, firms might raise wages and then pass these costs onto customers in the form of higher prices. This second-order effect has rather scant empirical support, and a number of mechanisms mitigate the passthrough from tightness to wages and wages to final prices. So although tightness is easing, its role in monetary policy is not obvious. It does, however, paint a consistent picture of the labor market alongside employment growth that is slowing but still high and an unemployment rate that is rising but still low.
1 [go back]
Specifically, for this blog post, we represent ![]() and then
and then ![]() and
and
![]() , where
, where ![]() is tightness. We set
is tightness. We set ![]() ,
, ![]() , though
, though ![]() does not matter because we look at percentage changes.
does not matter because we look at percentage changes.

By Santiago Martinez, an economic research analyst, and

David Wiczer, a research economist and associate adviser, both of the Atlanta Fed's Research Department