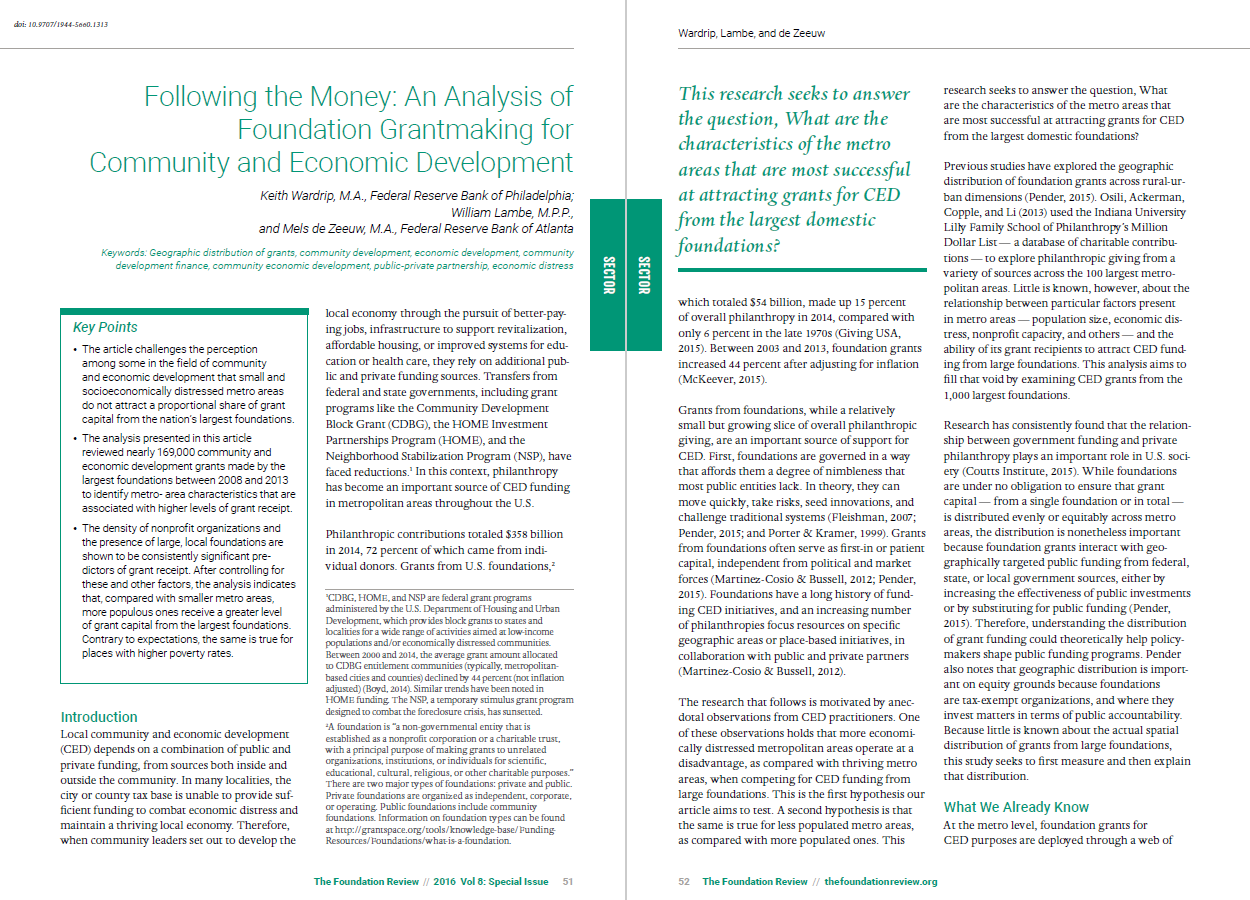
Use the check boxes and slider menu to select metro areas and year of grant making to explore. Move cursor over list of metro areas to reveal a magnifying glass search button. The map and charts will automatically update based on your selections.
The previous version of Following the Money allowed users to explore data on grants from large foundations. Based on feedback from a variety of community partners, we updated the Foundation Center data to 2014 and added several new sources of grant funding to the explorer tool. Users may now explore data on grants that support community and economic development from large foundations, from national intermediaries, and from key programs at the U.S. Department of Housing and Urban Development (HUD).
Large foundation grants
Data on grants and grant volume from large foundations originate from the Foundation Center's FC1000 data set, which includes grants of at least $10,000 made by the 1,000 largest foundations for each year from 2009 to 2014. To select grants specifically for CED projects and organizations, we parsed the grant or recipient subject for 122 relevant philanthropy classification codes and analyzed the description of a grant to ensure relevancy. We also sought to include only grants that were deployed within the recipient's metro area to improve local conditions; as such, we exclude grants to recipients with service areas extending beyond the borders of their metro area as well as grants used to fund research. We've also taken care to exclude grants to various national intermediaries, described below, so we do not double-count grant funds to communities from philanthropic sources. The tool includes almost 206,000 CED related grants from large foundations, totaling almost $20 billion in grant volume over the period 2009 to 2014.
National intermediary grants
Data on grants and grant volume from national intermediaries originate from Internal Revenue Service form 990s, which include grant amounts, recipient names, and locations. Using feedback from community and economic development industry experts, we selected 12 national intermediaries that operate across at least several states. The organizations are Boys and Girls Club USA, Capital Impact Partners, Corporation for Supportive Housing, Enterprise Community Partners, Housing Partnership Network, Jobs for the Future, Living Cities, Local Initiatives Support Corporation, Low Income Investment Fund, Neighborhood Reinvestment Corporation, Nonprofit Finance Fund, and Reinvestment Fund. Again, we seek to exclude grants for which the geographic service area extends beyond the borders of the relevant metro area. The tool displays data on some 12,000 such grants, totaling over $1.5 billion over the period 2009 to 2014.
U.S. Housing and Urban Development (HUD) grants
Data on HUD programs including the Community Development Block Grant (CDBG), HOME Investment Partnerships Program (HOME), and the Neighborhood Stabilization Program (NSP) grants for 2009 through 2014 are from HUD Exchange. We built a crosswalk to link grants to individual grantees (including local governments, nonprofit and for-profit organizations, public housing authorities, and tribal entities) to their respective metro areas. We exclude from the analysis NSP grants to organizations whose service area either exceeded one metro area or where this area was unclear. We also exclude CDBG grants awarded to state agencies for further distribution around the state. The CDBG grants displayed in the tool aggregate to some $13.6 billion, HOME grants to almost $4.9 billion, and NSP grants to just under $3.8 billion over the period 2009 to 2014.
Community context variables
A variety of factors combine to make a metro area more or less likely to attract grant funds. Based on research, we have included a selection of community context variables that have been shown to influence grant receipt at the metro level. The tool allows users to visualize the impact of particular community context variables on grant volume in metro areas. Community context variables include the following:
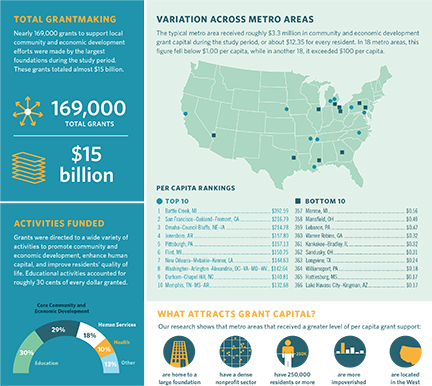
- Population size: Osili et al. (2013) find some evidence for a relationship between population size and grant receipt. Wardrip et al. (2016) find that metro areas between 250,000 and 500,000 receive, on average, some 40 percent greater grant receipt per capita than do metro areas with less than 250,000 residents. Metropolitan areas with more than a million residents receive, on average, slightly more than double that of the smallest metros. Population data are derived from the U.S. Census Bureau's Population Estimates program.
- Nonprofits per 10,000: Wardrip et al. (2016) find the number of CED related nonprofits per 10,000 inhabitants significant and positively related to grant receipt. Additionally, Osili et al. (2013) find that the number of nonprofits is related to more and larger grants of over $1 million. The National Center for Charitable Statistics provides the data, which are aggregated to the metro level.
- Nonprofit assets per capita: Pender (2015) finds this variable significantly and positively associated with grant receipt. The National Center for Charitable Statistics provides the data, which are aggregated to the metro level.
- Nonprofit revenues per capita: Initial modeling suggests some tentative evidence for a positive relationship between nonprofit revenues and grant receipt by national intermediary funders across all areas of the country. The National Center for Charitable Statistics provides the data, which are aggregated to the metro level.
- Large foundations in metro: Research by Schnoke (2015) finds some evidence that geographic proximity to grant makers, in this case in Ohio, is an important factor in grant receipt. Wardrip et al. (2016) find the presence of one of the largest 1,000 foundations in a metro area significant and positively related to CED grant volume per capita. A metro area with a large foundation received, on average, more than three times the grant volume than one that did not have such a philanthropic entity present. Data on foundations originate from the Foundation Center's FC1000 data set.
- Median household income: Osili et al. (2013) find a significant and positive relationship between per capita income and both the number and size of large philanthropic gifts. Initial modeling suggests a similarly positive relationship between median household income and per capita grant receipt from large foundations' CED funding. Median household income figures are from the U.S. Census Bureau's American Community Survey's 5-year estimates.
- Poverty rate: Previous research efforts found mixed results in a relationship between poverty and grant receipt. Osili et al. (2013) generally find poverty not a significant predictor, but the authors do find a negative relationship between poverty and the number of million dollar gifts. Pender (2015) finds some evidence of a positive correlation between poverty and foundation grant making. Wardrip et al. (2016) find that every percentage point increase in the poverty rate is related to a 6.8 percent increase in grant receipt per capita. Poverty data are from the U.S. Census Bureau's Small Area Income and Poverty Estimates and aggregated to the metro area level.
- Grant Volume per Capita: This represents the total grant volume made to recipients in a metro area divided by the metro area population. We adjusted dollar values for all monetary variables to 2014 dollars using the U.S. Bureau of Economic Analysis's National Income and Product Accounts "Price Indexes for Domestic Product" table to allow an accurate comparison of grant volume over time. Finally, we divided the total grant volume for all sources as well as the combination of HUD and philanthropic sources into low, medium-low, medium-high, and high quartiles for each metro area for display on the tool's map.
Sources
Osili, U., Ackerman, J., Copple, M., and Li, Y. (2013). "Million-Dollar Giving and Community Characteristics." Paper presented at the ARNOVA Conference, Hartford, Connecticut.
Pender, J.L. (2015). Foundation Grants to Rural Areas from 2005 to 2010: Trends and Patterns, Economic Information Bulletin 141. Washington, DC: U.S. Department of Agriculture Economic Research Service.
Schnoke, M. (2015). "Spotlight on Economic Development Grantmaking in Ohio." Urban Publications. 0 1 2 3 1286.
Wardrip, K., Lambe, W., and Zeeuw, M.d. (2016). "Following the Money: An Analysis of Foundation Grantmaking for Community and Economic Development," The Foundation Review 8, issue 3, article 7.
New article on intermediary grants
(forthcoming, de Zeeuw, Lambe, Thayer)
Short article on HUD grants
(forthcoming, de Zeeuw, Thayer)
New article on workforce development grants (forthcoming, de Zeeuw, Wardrip)
Read the accompanying article for Following the Money as it appeared in volume 8, issue 3 of The Foundation Review.

Download this article

Mels de Zeeuw
Federal Reserve Bank of Atlanta

found the geographic distribution of grant funding is highly uneven. On a per capita basis, grant dollars flow to some metro areas much more readily than to others.


