
Low- and moderate-income (LMI) renters experience constraints in securing rental housing that is both available and affordable at their income level, often forcing them to pay a disproportionately high share of their income on rent. Our Southeastern Rental Affordability Tracker, recently refreshed with the latest 2021 census data, shows that rental affordability has declined by certain measures in the six states in the Atlanta Fed's Sixth District (Alabama, Florida, Georgia, Louisiana, Mississippi, and Tennessee) since our 2019 update.1 In 2019, there was a deficit of 1,088,922 rental units affordable and available to lower-income renters in these six states. By 2021, that deficit grew 18 percent (an additional 193,649 units) to an overall shortage of 1,282,571 units available and affordable to lower-income renter households in these states. The continued loss of low-cost rental units and the increased input costs of materials, labor, and land have contributed to the increasingly tight affordable rental market.
With the Southeastern Rental Affordability Tracker, users can visualize rental housing affordability at the state, region, and city level across multiple dimensions, including income level, age, and race or ethnicity. In this Partners Update, we highlight several data points accessible through the tool and outline three potential use cases for policymakers, practitioners, funders, and other interested users.
Highlights from the Tool
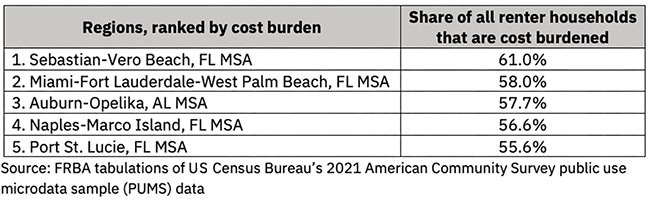
The Southeastern Rental Affordability Tracker uses a standard definition for cost-burdened households: those that spend more than 30 percent of monthly household income on rent. Spending more than 30 percent of income on housing constrains the amount of household income available for spending on other basic needs and limits households' resilience and ability to build assets and pursue long term economic mobility. In 2021, of the regions presented in the tool, the Sebastian-Vero Beach, Florida, Metropolitan Statistical Area (MSA) had the highest percentage of cost burdened renter households at 61 percent. In addition to percentages, the tool also presents the number of cost-burdened households; that 61 percent translates to 9,191 cost-burdened households in this metro. Many of these cost-burdened households are extremely low-income. Of the renter households in the Sebastian-Vero Beach, Florida, MSA making less than 30 percent of area median income (AMI), 84 percent, or 3,276 households, are cost burdened. Among the five regions with the highest share of cost-burdened renters of all income levels, four were in Florida and one was in Alabama (see table).
Table 1: Regions in the Southeastern Rental Affordability Tracker with the highest share of cost-burdened renter households (all income levels)
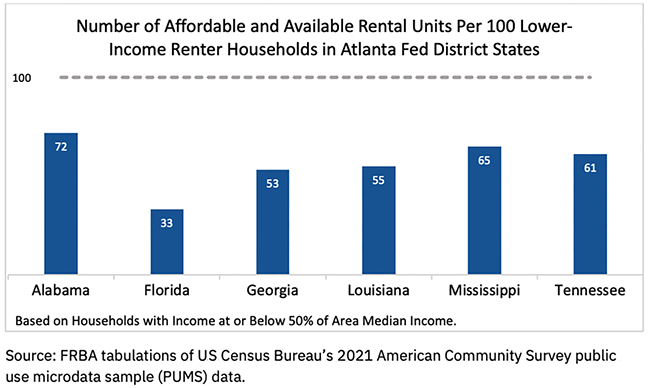
In addition to providing information on whether the rents households pay relative to their income are affordable, the tool also provides the number of available units that are affordable to LMI renters within a given area. The tool provides net numbers (expressed as deficits or surpluses) for each geography and the share of available units per 100 renter households. In 2021, Florida experienced a deficit of 656,597 rental units available and affordable to lower-income households with incomes at or below 50 percent of AMI, which translated to 33 homes available and affordable per 100 households at that income level. Other states in the southeast had nontrivial but less severe shortages of affordable and available rental units per 100 lower-income households (see figure 1).
Figure 1: Number of affordable and available rental units per 100 lower-income renter households in the Atlanta Fed's Sixth District states
Potential Use Cases
The Southeastern Rental Affordability Tracker provides valuable data for many types of users. We highlight three potential uses for the tool:
- Diagnosing challenges: Some communities may be aware of an affordable housing shortage in their area but may not be certain who is most affected. By using the tool's individual renter demographics functionality, users can examine the race or ethnicity and income level of renters, and how many renters in those subpopulations are considered not cost-burdened, cost-burdened, or severely cost-burdened. This analysis can add specificity in defining a community's housing challenges.
- Goal setting: Policymakers looking to set goals for affordable housing production or preservation may use the tool to determine the number of available and affordable rental units in their community. If a community is experiencing a deficit, that number can help inform a community's affordable housing strategy.
- Targeting investment: Financial institutions and other funders may also be able to identify affordable housing needs in a community using the tool. Using a nuanced, data-informed understanding of rental cost burdens and the availability of affordable rental housing in a community, such entities may be better able to respond to the needs of their target markets.
The Southeastern Rental Affordability Tracker includes detailed data with many potential uses. Check out the data tool and see what insights the latest 2021 data may offer your community. Historical data are also available for 2015 through 2019.
For questions regarding the Southeastern Rental Affordability Tracker, please contact Grace Meagher at grace.meagher@atl.frb.org or Pearse Haley at pearse.haley@atl.frb.org.
By Grace Meagher, CED research analyst, and Pearse Haley, CED research analyst. The views expressed here are the authors' and not necessarily those of the Federal Reserve Bank of Atlanta or the Federal Reserve System. Any remaining errors are the authors' responsibility.
_______________________________________
1 The Southeastern Rental Affordability Tracker tool does not include 2020 American Community Survey (ACS) data due to COVID-19 related disruptions in census data collection. A low response rate in 2020 required the use of weights that are not consistent with or comparable to data from other years. Thus, the Census Bureau does not recommend users compare the 2020 “experimental” estimates with standard estimates from other years. More information about the disruption in data collection and the resulting 2020 ACS one-year experimental data is available from the US Census Bureau.