
Key Takeaways:
- For southeastern renter households, Emergency Rental Assistance disbursement experienced delays as compared to national numbers and eviction moratoria appear to have been less effective.
- Employment and rent cost data point to three hard to stay Florida metro areas where renter households that lost income during the pandemic may have had a difficult time keeping and finding housing.
- Updated data show subsequent employment growth in these hard to stay metro areas that outpaces the national average.
In the early days of the COVID-19 pandemic, concerns about housing stability rose as the spreading virus shut down businesses, eliminating jobs. This was of particular concern for renters, who paid a comparatively larger portion of their income towards housing than owners during the first year of the pandemic.1 Over the course of the pandemic, local, state, and federal policies were implemented to address potential rental instability, resulting in a patchwork of programs and experiences for renter households across the country.
In a new discussion paper, "Sheltering in Place? A Closer Look at Pandemic Rental Instability in Six Southeastern States," we explored implementation of federal policies such as eviction moratoria and Emergency Rental Assistance (ERA) programs, which were intended to stabilize rental households across the Southeast (Alabama, Florida, Georgia, Louisiana, Mississippi, and Tennessee). "Sheltering in Place?" follows our prior analysis of the challenges and opportunities presented by Emergency Rental Assistance programs across our district.
These unprecedented federal pandemic assistance policies relied heavily on state and local governments for implementation. Based on available data including ERA disbursement figures and eviction filing counts, we found that the effectiveness of the policies to stabilize renters varied greatly by geography and relied upon their efficient implementation, a consistent return of jobs, and stable rent prices. For southeastern renter households, we found that eviction moratoria appear to have been less effective and ERA disbursement experienced delays as compared to national numbers.
Alongside our analysis of evictions and rental assistance, we explored the housing instability of working renters during the pandemic using employment and rent data at the metro area level across the Southeast. Overall, rebounds in employment were not equally experienced across all southeastern metropolitan areas in 2020. Meanwhile, rent increased significantly in southeastern states and metros from 2020 to 2022, destabilizing renter households further. Across the Southeast, policies designed to stabilize renter households did not achieve the same impact as observed at the national level especially when deployed in metro areas with relatively lower employment growth and larger relative increases in median rent.
To understand metro level trends in early pandemic employment loss and recovery we calculated the percent change in employment from the first to second quarter and from the third to fourth quarter of 2020. Geographies with percent changes in employment below the national average from Q1 to Q2 are considered hardest hit.2 Geographies with percent changes in employment below the national average from Q3 to Q4 are considered slow to recover.3
For a full list of cities and metro areas hardest hit and slow to recover, please see "Sheltering in Place?" Appendix 2.
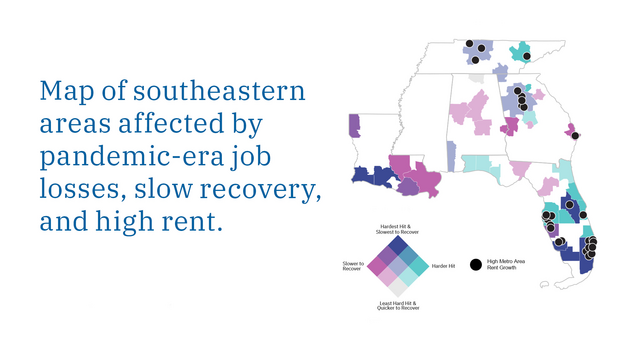
The Southeast’s hardest hit metro areas were largely concentrated in either coastal zones with high levels of tourism-driven service and hospitality employment, or in inland areas with high levels of retail employment. Within these hardest hit metro areas, we found that some were also slow to recover. Metros that were both hardest hit and slow to recover tended to have either a higher overall share of employment in the tourism, hospitality, or retail sectors or they experienced deeper employment losses within these industries as compared to other metro areas across the Southeast. Renter households in these hardest hits and slow to recover metro areas also experienced higher pre-pandemic levels of cost-burden when compared to the nation, overall.4
In addition to analyzing metro employment change, we explore places we refer to as hard to stay: metro areas that were both hardest hit and slow to recover and which also experienced higher than average increases in median rent during the pandemic. This combination of employment shocks and increased rental housing costs may have led to an environment that could be difficult to stay in for low- and moderate- income renter households. The paper identified three metro areas in the six southeastern states as hard to stay: Miami-Fort Lauderdale-Pompano Beach, Naples-Marco Island, and Orlando-Kissimmee-Sanford. Each of these metro areas is located in Florida. Limited employment data in some areas across the Southeast prevented the study from identifying other—perhaps smaller or more rural—communities that experienced large losses of employment, a slower recovery, and large increases in median rent.
While our discussion paper focuses on 2020 through 2022 data, new data have since been released. In Table 1, we provide an updated look into employment and rent trends the three Florida metro areas designated hard to stay in the discussion paper.
Table 1: Hard to Stay Metro Areas in the Atlanta Fed District
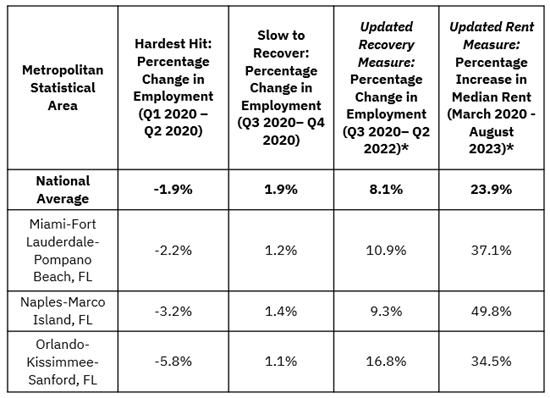
Sources: US Census Bureau, Quarterly Workforce Indicators (2020-2022)*; Apartment List State-Level Historic Median Rent Estimates; authors’ calculations
While the pandemic drove sharp employment losses in 2020, updated data show positive gains in employment from Q3 2020 to Q2 2022 for the three hard to stay metros. All three metro areas experienced employment growth that outpaced the national average. However, since the onset of the pandemic in March 2020, each of the three metro areas have also experienced a median rent increase that exceeded the national average.
Our initial hard to stay analysis identified areas with pandemic employment shocks and slower recoveries that affected industries with lower wage employees. These areas also tended to have an outsized share of cost-burdened renter households heading into the pandemic. Based on our analysis we can’t say employment growth that outpaced the national average resolved the market conditions that made these metro area’s hard to stay during the pandemic. More analysis would be necessary to better understand whether increased employment translated into greater housing stability for renter households that were destabilized during the pandemic.
For more data on more metro areas and an in-depth discussion of renter experiences across the Southeast, including the rollout and impact of federal pandemic rental housing policy, see our full paper: "Sheltering in Place? A Closer Look at Pandemic Rental Instability in Six Southeastern States."
By Grace Meagher, CED analyst; Anthony Tringali, former CED intern; Pearse Haley, senior CED analyst; and Sarah Stein, senior CED advisor. The views expressed here are the authors' and not necessarily those of the Federal Reserve Bank of Atlanta or the Federal Reserve System. Any remaining errors are the authors' responsibility.
_______________________________________
1 "Renters Were Particularly Burdened in the First Year of the Pandemic | Joint Center for Housing Studies," Harvard Joint Center for Housing Studies, 2022, https://www.jchs.harvard.edu/son-2022-cost-burdens. The term "cost-burdened" refers to households that pay more than 30 percent of their income towards housing payments.
2 We used the percent difference in employment from first to the second quarter of 2020 to measure the early pandemic employment loss in our study geographies.
3 We used the percent change in employment for the third to the fourth quarters in 2020 to measure the earliest subsequent recovery in employment.
4 Please see our Southeastern Rental Affordability Tracker at https://www.atlantafed.org/community-development/data-and-tools/southeastern-rental-affordability-tracker.