Key takeaways:
- Of the Southeast’s 2,069,151 rental units priced affordably for renters making less than 50 percent of Area Median Income (AMI), 822,998 units were occupied by a household earning above that amount.
- Over 80 percent of upper-income households—those earning more than 120 percent of AMI—occupy rental units that are affordable and could otherwise be available for low- and moderate-income households with incomes below 120 percent of AMI.
- Patterns of downward sorting of higher-income households into more affordable rental homes places pressure on the supply of affordable homes for lower-income families, indicating that building more market-rent rental homes may not be sufficient to relieve housing deficits for low-income rental households.
Research has shown that access to affordable housing has a positive impact on resident health1 and provides financial flexibility for households to meet other needs.2 However, across the nation low- and moderate-income renter households face a shortage of affordable and available housing. As of 2023 no state or metropolitan area had enough supply of affordable and available homes to house the population of extremely low-income households.3 Moreover, households with children present are more likely to experience greater cost burdens, relative to households without children.4
For a rental unit to be considered affordable for a particular household, it must be priced at no more than 30 percent of the renter’s household income. When a household spends more than 30 percent of its income on housing (including all utilities except internet access), it is considered cost burdened. This is a standard definition used by the US Department of Housing and Urban Development (HUD) and other organizations to measure housing affordability.5 The Atlanta Fed’s Southeastern Rental Affordability Tracker monitors the number and share of cost-burdened households and the availability of affordable rental homes. It provides data for states, regions, and cities in the Federal Reserve’s Sixth District. The tool explores different household income levels and demographic characteristics using data from the American Community Survey (ACS).6 Across the southeastern states partially or wholly in the Sixth District (Alabama, Florida, Georgia, Louisiana, Mississippi, and Tennessee) there is a considerable shortage of affordable housing available for low-income renters. For every 100 renter households making at or below 50 percent of AMI, only 49 units are affordable and available (see figure 1), leaving a deficit of 51 affordable and available homes.
Figure 1. Number of Affordable and Available Rental Homes per 100 Households by Area Median Income (AMI) in the Southeast
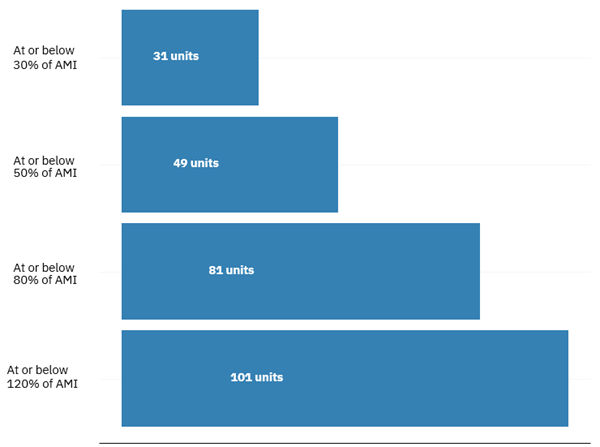
Source: Federal Reserve Bank of Atlanta (FRBA) calculations of 2023 American Community Survey (ACS) public use microdata sample (PUMS) data.
While a greater share of rental homes priced affordably for low-income renters exist, not all of them are available to those households. Some of those affordably priced homes are instead occupied by households with incomes above 50 percent AMI. Figure 2 shows a total of 2.54 million renter households earning at or below 50 percent of AMI compared with just 2.07 million rental units available at that income level, leaving a deficit of nearly half a million units at that income level. Of those 2.07 million units, however, 0.82 million are occupied by households earning more than 50 percent of AMI, meaning that the number of affordable units that are also available to households at that income level is just 1.25 million and the apparent deficit is 1.29 million. This tells us that shortages of affordable units may be larger than they appear when we examine affordability and availability together.
Furthermore, in the 80 percent of AMI (low-income) bucket, what first appears to be a surplus of affordable homes is actually a shortage once we consider the availability of those homes to low-income households. Figure 2 shows 4.56 million total units at this income level compared with just 3.95 million renters, leaving an apparent surplus of 0.61 million households. Higher-income households occupy 1.37 million of those units, however, leaving just 3.19 million affordable and available units. By examining both affordability and availability, what initially appears to be a surplus becomes a deficit. A true surplus of affordable and available rental homes doesn’t exist until we expand the household income to 120 percent of AMI, at which point there is a relatively small surplus of about 50,000 affordable and available homes, a differential not easily distinguishable in figure 2.
Figure 2. Number of Affordable and Available Rental Homes and Households by Area Median Income (AMI) in the Southeast
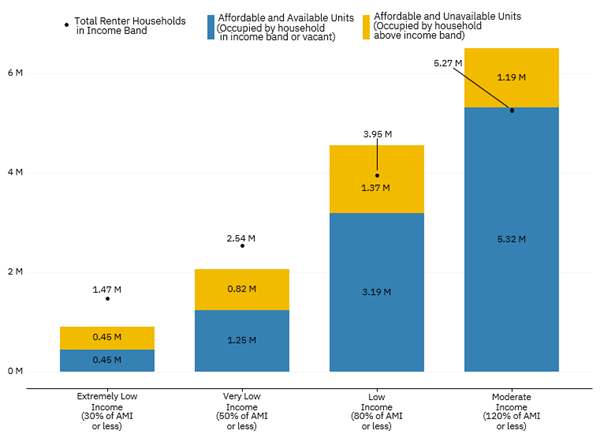
Source: FRBA calculations of 2023 ACS PUMS data.
So far, we have conducted our analysis of rental home affordability and availability using an inclusive lower bound, meaning that we have included all homes at or below the level of income we are analyzing. However, we can further divide the occupancy of affordable and available homes by income buckets with a distinct upper and lower bound to obtain even greater insight into household sorting and the availability of affordable rental homes. By household sorting, we mean the distribution of incomes of the occupants of rental units priced at a particular affordability level. By segmenting households and homes into distinct affordability bands, we can better understand how households within these bands are sorting into rental units. We can more precisely analyze the incomes of households that are occupying the affordable housing stock in the Southeast, giving us a clearer understanding of market pressure on the supply of lower-cost units. It also allows us to not only consider the incidence housing cost burden (when a lower-income household “sorts up” into a home costing upwards of 30 percent of their income) but to also observe patterns of housing cost relief (when a higher-income household “sorts down” into a home costing less than 30 percent of their income).
Figure 3 identifies the number of rental homes that are affordable to households in distinct income buckets and the number of households of various incomes that sort into these homes. For example, just 249,000 units affordable to very low-income households earning between 30 percent and 50 percent of AMI are occupied by households at that income level. However, the remaining three-quarters (824,000) of very low-income households occupy units priced either above this range (where they are cost burdened) or below it (where they are not cost burdened but make a unit unavailable to an extremely low-income household). We can see that the majority of very low-income renters live in homes that are out of their affordability range, most commonly occupying homes that are affordable to households making 50 to 80 percent of AMI.
This analysis also shows us that over 80 percent of upper-income households—those earning more than 120 percent of AMI—occupy rental units that are affordable and could otherwise be available for low- and moderate-income households with incomes below 120 percent of AMI (figure 3). A sizeable percentage (41 percent) of upper-income renter households live in homes with rent prices that would provide affordable housing for households earning less than 80 percent of AMI. In occupying these homes, these households experience some measure of housing cost relief in their balance sheet, allowing funds not spent on housing to flow to other cost centers.
Figure 3. Number of Occupied Rental Homes by Rent Affordability and Resident Household Income in the Southeast
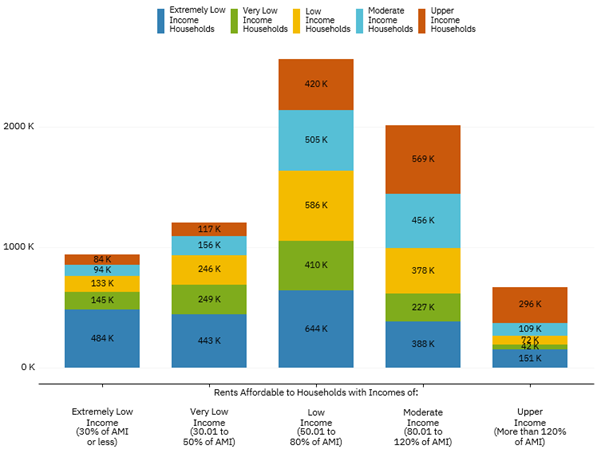
Source: FRBA calculations of 2023 ACS PUMS data.
The data in figure 3 demonstrates a deficit of homes affordable and available to low-, very low-, and extremely low-income households across the Southeast. It further reveals that as lower-income renters sort into unaffordable homes, increasing their housing cost burden, higher-income renter households are seeking housing cost relief by sorting into homes priced affordably for those with lower incomes. Given this analysis, building more market-rate rental housing may be insufficient to address affordable rental housing shortages. This observation is consistent with other research finding that increasing market-rate supply alone is an insufficient solution for to the lack of affordable housing. The aforementioned studies suggest a variety of housing policy interventions that could support low-income household access to affordable rental homes, including rental subsidy expansions,7 requirements or incentives to build affordable units in new developments (often referred to as inclusionary zoning),8 zoning reform that takes affordable access into consideration,9 and the development of social housing through public and nonprofit avenues.10 For readers who are interested in understanding more about rental affordability and availability in their area, visit the Southeastern Rental Affordability Tracker. This tool can further assist policymakers and practitioners as they identify the housing shortages in their communities, set goals for affordable housing, and implement a data-driven approach to lowering cost burdens for low- and moderate-income renters.
By Sarah Stein, CED senior adviser, Aidan Rickaby, former CED intern, and Pearse Haley, quantitative research analysis specialist. The views expressed here are those of the authors' and not necessarily those of the Federal Reserve Bank of Atlanta or the Federal Reserve System. Any remaining errors are the authors' responsibility.
The Federal Reserve Bank of Atlanta’s Community and Economic Development function supports the Central Bank's mandate of stable prices and maximum employment by helping improve the economic opportunity of low- and moderate-income (LMI) individuals and underserved places for a stronger economy for all Americans. Community development is one of the Federal Reserve’s core functions and this responsibility is rooted in its mandates from Congress. Partners Update articles address community and economic development trends, issues, and events. Find more research, use data tools, and sign up for email updates at atlantafed.org/commdev.
1 Bill Wright, Grace Li, Maggie Weller, and Keri Vartanian, “Health in Housing: Exploring the Intersection between Housing and Health Care” (Enterprise Community Partners, Inc., February 2016), https://www.enterprisecommunity.org/sites/default/files/2021-06/Health%20in%20Housing%20Exploring%20the%20Intersection%20between%20Housing%20and%20Healthcare.pdf; Alan E. Simon, Andrew Fenalon, Veronica Helms, Patricia Lloyd, and Lauren Rossen, “HUD Housing Assistance Associated With Lower Uninsurance Rates And Unmet Medical Need,” Health Affairs 36, no. 6 (June 2017): 1016–23, https://doi.org/10.1377/hlthaff.2016.1152; Rachel Meltzer and Alex Schwartz, “Housing Affordability and Health: Evidence From New York City,” Housing Policy Debate 26, no. 1 (January 2, 2016): 80–104, https://doi.org/10.1080/10511482.2015.1020321.
2 Joint Center for Housing Studies of Harvard University, “State of the Nation’s Housing 2013,” (Joint Center for Housing Studies of Harvard University, 2012), https://www.jchs.harvard.edu/sites/default/files/son2012.pdf. These researchers find that low-income families with affordable housing are able to spend more on food, clothes, pension and retirement, and healthcare.
3 Extremely low-income households include those households with income at or below 30 percent of the AMI for their location. Raquel Harati, Dan Emmanuel, Katie Renzi, and Andrew Aurand, “The Gap: A Shortage of Affordable Homes” (National Low Income Housing Coalition, March 2025), https://nlihc.org/gap.
4 Whitney Airgood-Obrycki, Alexander Hermann, and Sophia Wedeen, “The Rent Eats First: Rental Housing Unaffordability in the US,” (Joint Center for Housing Studies of Harvard University, 2021), https://www.jchs.harvard.edu/sites/default/files/research/files/harvard_jchs_rent_eats_first_airgood-obrycki_hermann_wedeen_2021.pdf.
5 US Department of Housing and Urban Development, Glossary of HUD Terms | HUD USER, "Affordable Housing," accessed June 25, 2025, https://archives.huduser.gov/portal/glossary/glossary_a.html.
6 At the time of publication, the Southeastern Rental Affordability Tracker provides 2021 and 2022 data, pending a 2023 data update our analysis is based on 2023 ACS microdata.
7 Vicki Been, Ingrid Gould Ellen, and Katherine O’Regan, “Supply Skepticism: Housing Supply and Affordability,” Housing Policy Debate 29, no. 1 (January 2, 2019): 25–40, https://doi.org/10.1080/10511482.2018.1476899; Raquel Harati, Dan Emmanuel, Katie Renzi, Andrew Aurand, “The Gap: A Shortage of Affordable Homes.”
8 Claudia D. Solari, Christina Plerhoples Stacy, and Brendan Chen, “Building More Homes Isn’t Enough to Solve the Housing Crisis,” Urban Wire (blog), March 28, 2025, https://www.urban.org/urban-wire/building-more-homes-isnt-enough-solve-housing-crisis; Been, Ellen, and O’Regan, “Supply Skepticism.”
9 Solari, Stacy, and Chen, “Building More Homes Isn’t Enough to Solve the Housing Crisis”; Been, Ellen, and O’Regan, “Supply Skepticism”; Harati et al., “The Gap: A Shortage of Affordable Homes.”
10 Solari, Stacy, and Chen, “Building More Homes Isn’t Enough to Solve the Housing Crisis.”