

National affordability
Home ownership affordability declined in July as home prices continued to push higher in the United States, according to the Federal Reserve Bank of Atlanta’s Home Ownership Affordability Monitor (HOAM) index. Despite historically low interest rates, higher home prices and the continued strain on earnings during the COVID-19 pandemic continue to make it difficult for a household earning an average income to afford to own a home.
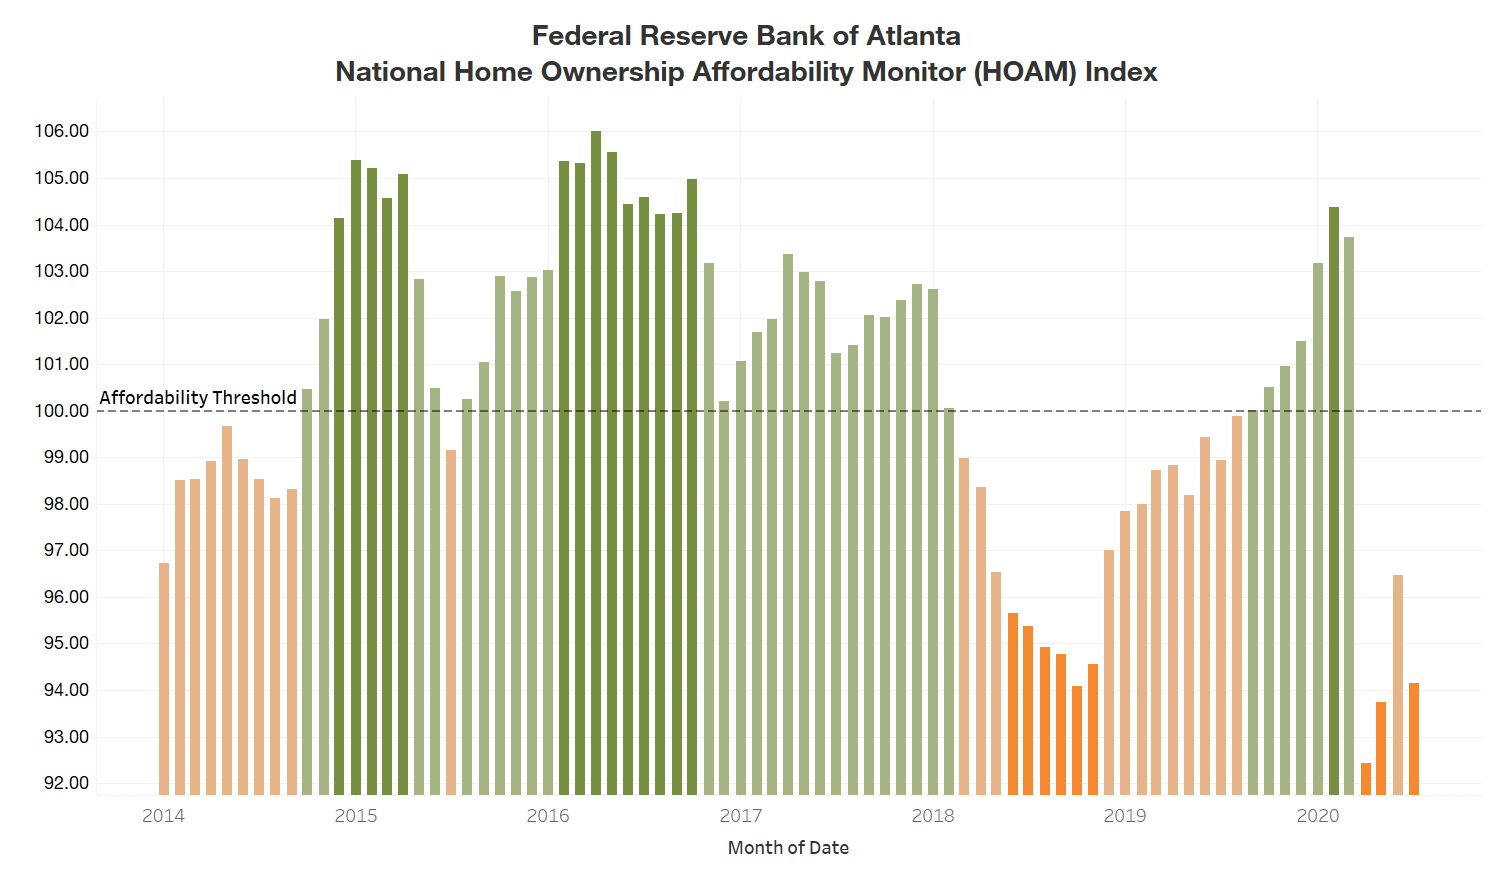
A HOAM index below 100 indicates that the median-priced home is unaffordable to the median-income household given the current interest rate. In July, the HOAM index dropped to 94.1 from a revised 96.5 in June, indicating that the median-priced home remained too expensive for the median-income household. The HOAM index was below its 98.9 reading a year earlier. Home ownership costs in July (as measured by principal and interest, taxes, and insurance) accounted for 31.9 percent of the annual median income of U.S. households, which is above the 30 percent affordability threshold set by the U.S. Department of Housing and Urban Development. July marked the fourth month in a row that the national HOAM index was below 100.
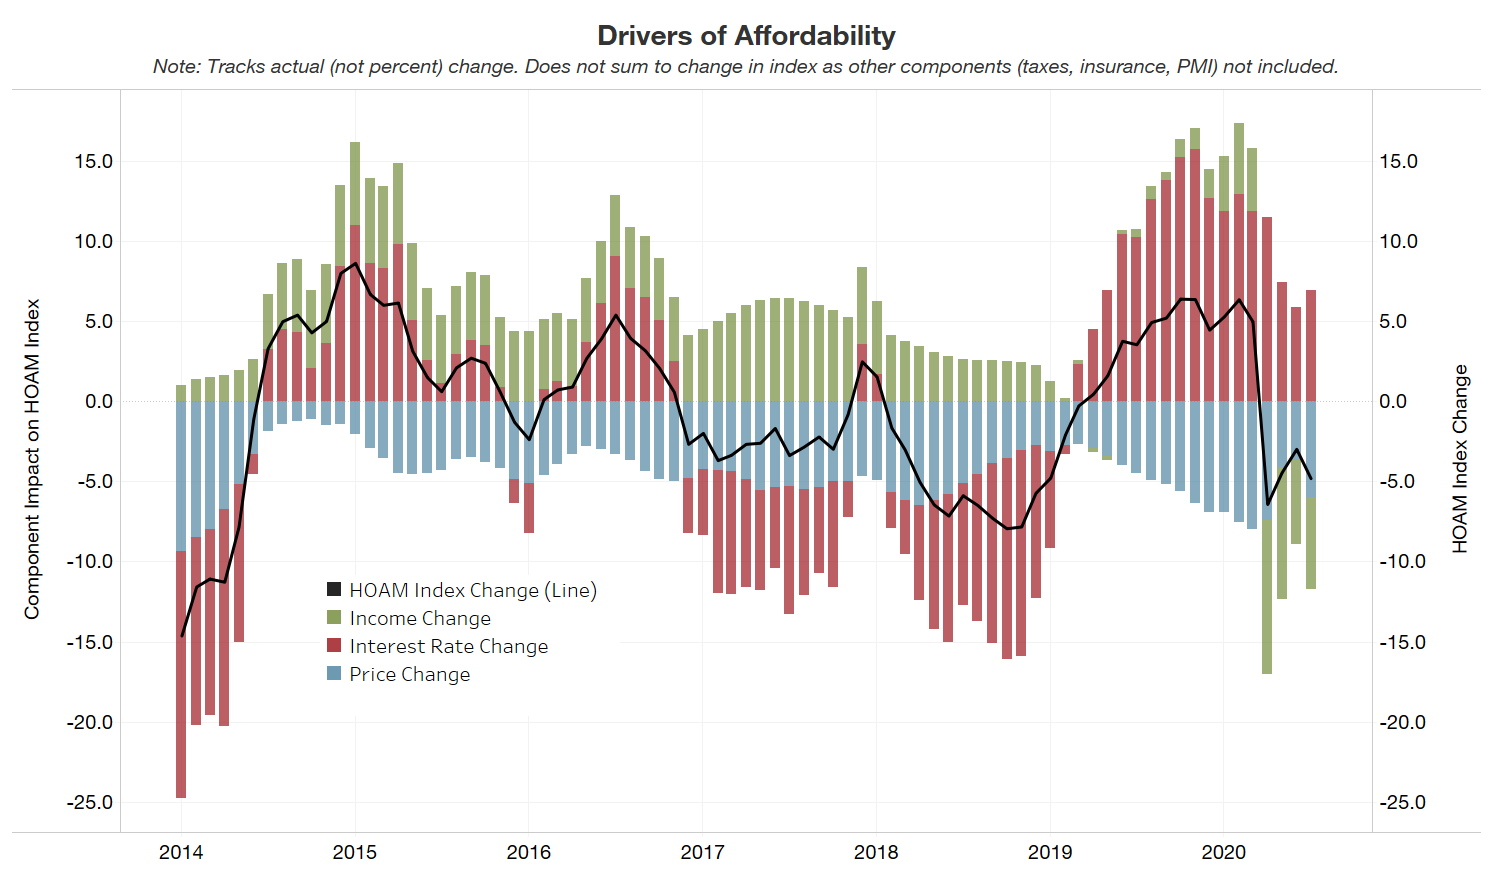
The 30-year fixed mortgage interest rate ended the month of July at 3 percent, a drop of 1.4 basis points (bp) from June and a 20 bp decline from July 2019. The estimated median household income in the United States was $59,315 in July, down 4.9 percent from a year earlier, as a result of the continued strain on incomes from the COVID-19 pandemic. Meanwhile, the national median existing home price (three-month moving average) rose to $289,844 in July, up 4.5 percent to from a revised $277,344 for June. The latest price represented an 8.4 percent jump from a year ago. Prolonged inventory shortages in many markets are exerting upward pressure on home prices, which reached record levels nationally in July.
Regional affordability
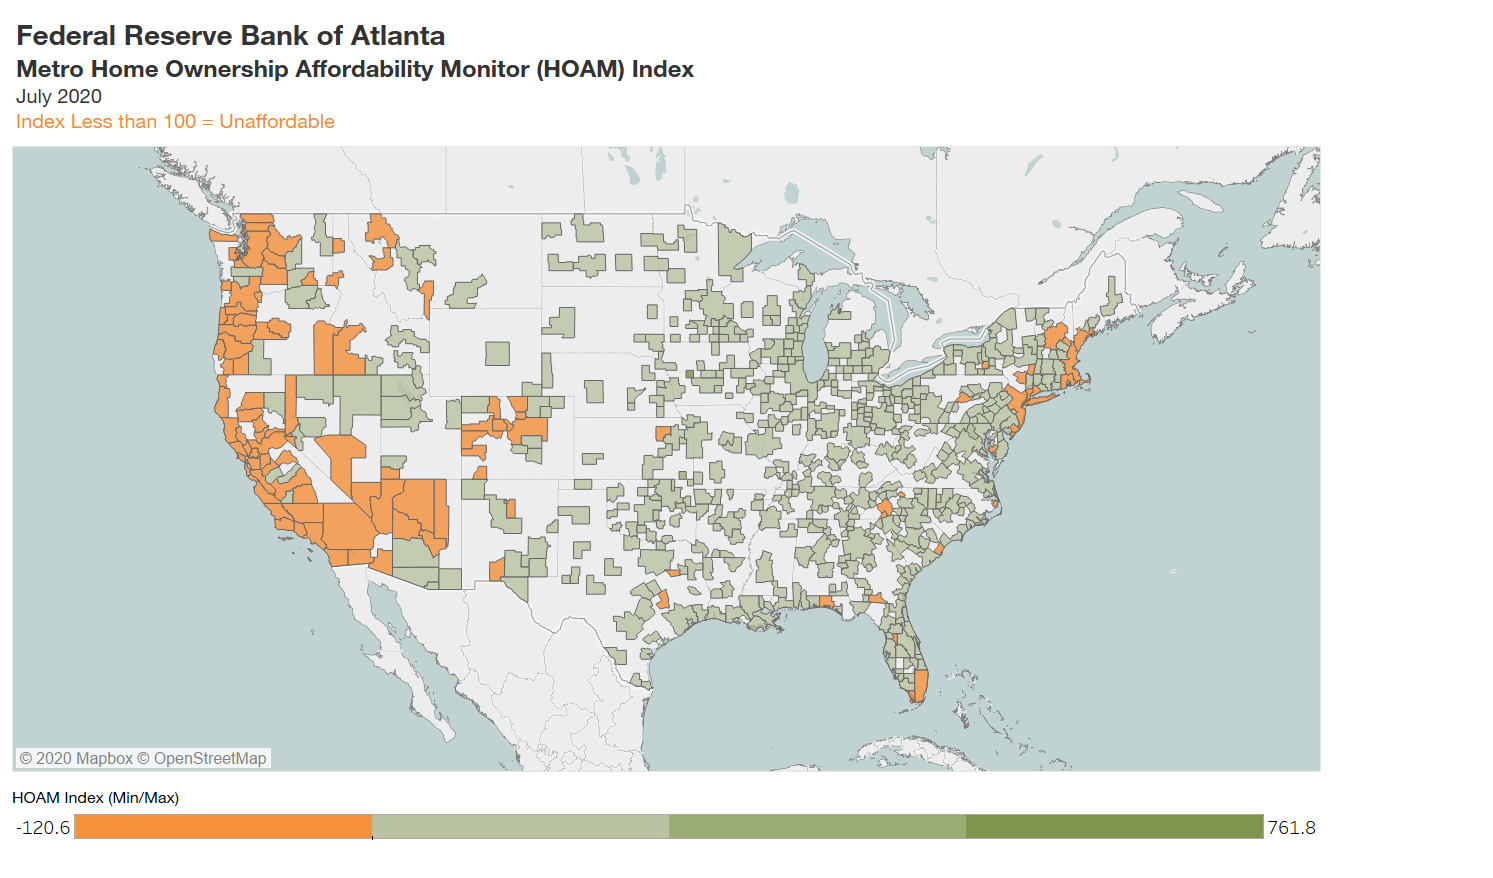
Eighteen percent of metro areas in the United States had a HOAM index below 100 in July, indicating that they were unaffordable to median-income households. By contrast, a clear majority of metro areas—82 percent—had an index above 100 and were considered affordable. Even so, affordability fell in 46 percent of metro areas from June to July as rising home prices and lower household incomes took their toll. In general, high-cost metro areas on the West Coast as well as in the Northeast and South Florida were among the least affordable, while metros in the middle of the country, particularly in the Midwest, tended to be the most affordable.
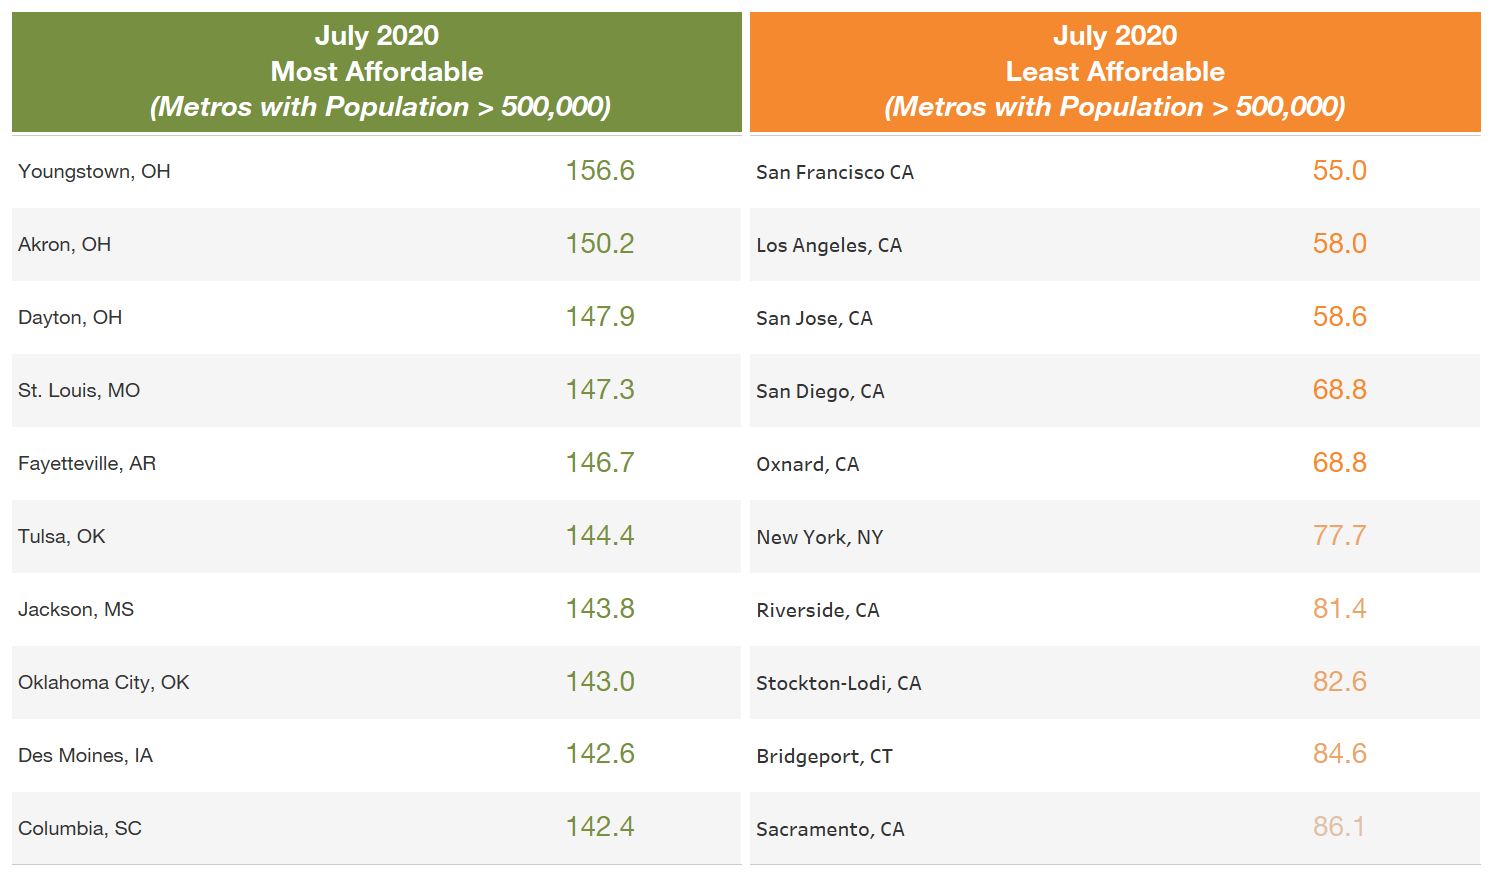
Among the nation’s largest metro areas (those with populations greater than 500,000), San Jose-Sunnyvale-Santa Clara, California, was the most expensive in July with a median existing home price of $1.18 million. The median price rose by 8.4 percent over the past year in the region. Meanwhile, San Francisco-Oakland-Hayward, California, was the nation’s least affordable large metro in July with a HOAM index of 55. Even though homes in San Jose were more expensive, household incomes there were generally higher than in San Francisco ($130,703 for San Jose compared with $113,775 in San Francisco), making San Jose slightly more affordable.
With a median existing home price of $1.17 million, the annual share of income needed to own a home in San Francisco was 58 percent, the highest home ownership cost among large metros and well above the 30 percent that is considered affordable. Still, rising home prices continue to be somewhat offset by falling interest rates and stable household incomes, which led to a modest improvement in overall home ownership affordability in San Francisco compared with the previous month.
The least expensive large metro area in July was Youngstown, Ohio, where the median sales price was $136,819. Home prices there rose 6.8 percent over the past year. Youngstown was also the most affordable large metro in the nation in July with a HOAM index of 156.6. Its estimated median household income in July was $48,950, and, on average, households there spent 19 percent of their annual earnings on housing. This represents the lowest home ownership cost among large metros. Despite rising home prices, lower interest rates helped to keep home ownership affordability relatively high in Youngstown.
With a median existing home price of $826,875, a median household income of $89,413, and a HOAM index of 55.7, Santa Cruz-Watsonville, California, was both the most expensive and least affordable small metro area in the United States (metros with populations below 500,000) in July. Meanwhile, the least expensive small metro during the month was Danville, Illinois, where the median existing home price came to $95,250. Kokomo, Indiana, remained the most affordable small metro with a HOAM index of 221.2. Its median home value was $125,424, and its median household income was $57,599. The median existing home price in the region declined 8.1 percent over the past year.
Spokane, Washington; Birmingham, Alabama; and Greenville, South Carolina, had the greatest improvement in affordability among large metro areas. In Spokane, affordability rose by 10.1 percent from June to July, while affordability in Birmingham and Greenville rose by 6.4 percent and 4.3 percent, respectively. Despite flat to rising home prices in these markets, low interest rates have been enough to offset higher costs, leading to an improvement in affordability. Meanwhile, Charleston, South Carolina; Harrisburg, Pennsylvania; and Bridgeport, Connecticut saw the sharpest falloff in home ownership affordability—with declines of 6.2 percent, 5.2 percent, and 4.3 percent, respectively—in July from June. All three regions had double-digit percentage increases in home prices over the past year, and declining interest rates have not been enough to offset increasing home ownership costs.
COVID-19 impact
Demand for housing remains exceedingly strong, as relatively low interest rates continue to fuel home sales. Existing home sales rose by 10.5 percent in August compared with the year earlier, according to the National Association of Realtors. However, existing home inventory dropped by 18.6 percent over the same period. As such, existing home supply has not kept up with the pace of sales, and home prices continue to climb. In addition, the lack of supply continues to fuel demand for new home construction. Although new home sales are strong, higher lumber prices and constraints on labor have caused construction costs to rise. These factors, combined with pressure on builders to keep pace with demand, are driving up new home prices. In the months ahead, although low interest rates will help support gains in purchasing power for many households, rising prices for existing and new houses are expected to suppress affordability for buyers looking to purchase a home.
The number of mortgage loans in forbearance continues to drop and now accounts for 5.6 percent of all mortgages, according to data provided by Black Knight. Still, delinquencies remain elevated, particularly in regions that have significant exposure to industries that were hard-hit by the pandemic such as leisure and hospitality. In addition, FHA and VA mortgages tend to have higher delinquency rates compared with conventional mortgages and, according to Black Knight, a higher share of these loans remain in forbearance (9.5 percent). As forbearance programs expire in the months ahead, high levels of mortgages that will still be delinquent nationally could raise the possibility of increased mortgage defaults, which would have a significant impact on the housing market.
For more details, including metro level analysis, please visit the interactive Home Ownership Affordability Monitor tool.

Domonic Purviance
Senior Financial Specialist in the Atlanta Fed's Supervision, Regulation, and Credit Division