Regional overview: Southeast
When discussing national trends in commercial real estate, identifying overarching themes can make it easier to understand broader market behavior. The CRE Momentum Index (CREMI) tracks movements in specific variables (such as occupancy/vacancy rate, rent growth, and construction forecast) in local markets and provides a targeted view of real estate conditions. This article focuses specifically on the U.S. Southeast, which includes markets in the following 10 states: Alabama, Florida, Georgia, Kentucky, Mississippi, North Carolina, South Carolina, Tennessee, Virginia, and West Virginia.
Overview
The key descriptors of a market’s momentum are “upward” and “downward,” because different variables have different implications to the overall market movement, both individually and in combination with other variables. For example, by itself, a low vacancy rate could indicate a strong, well-occupied market. However, if a low vacancy rate is combined with unusually high rent growth and limited new construction, it could indicate a negative condition, such as potential undersupply or unaffordability of space. These are the kinds of determinations users can make with information gathered from the CREMI as they come to understand not only how the market is shifting, but what consequences may result.
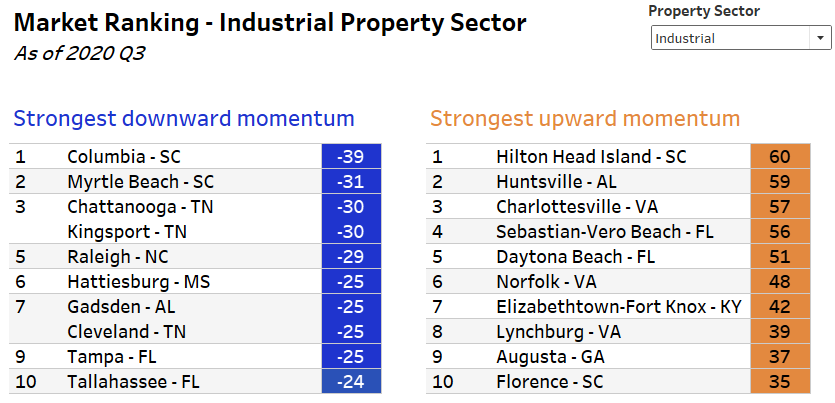
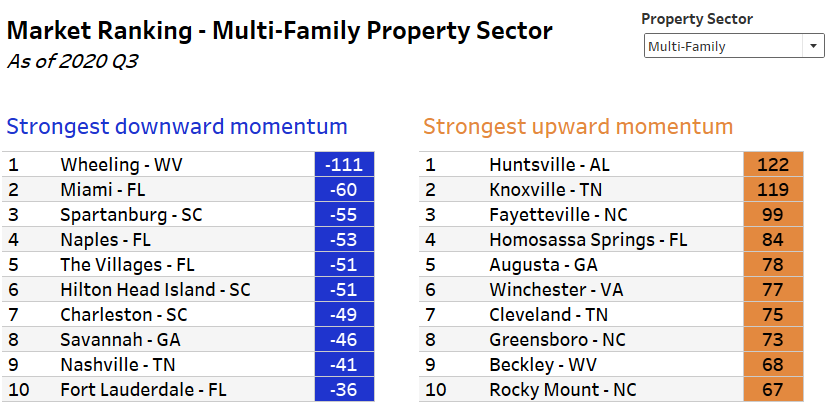
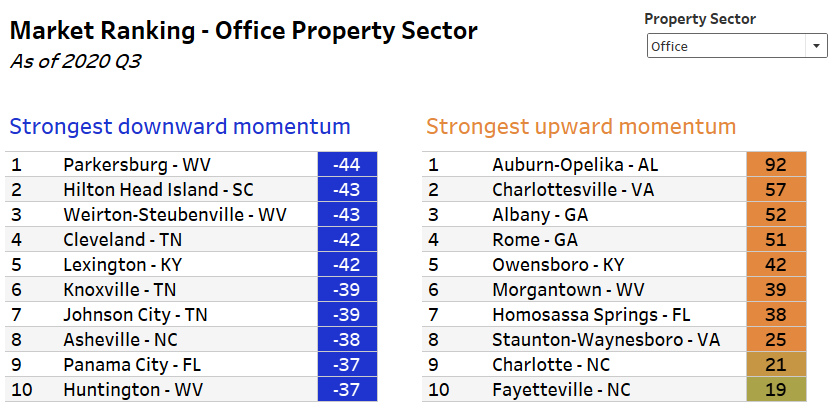
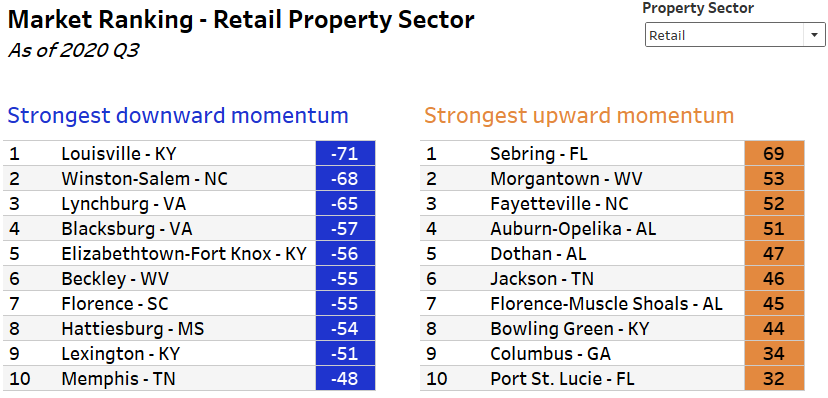
The CREMI interactive tool gives users a view of the markets with the strongest upward or downward momentum in each property sector across the entire United States. By filtering the results to include only the Southeast, the tool generated new graphics showing the market rankings for each property type in the region. The breakdown by property type of Southeast markets with the strongest upward and downward momentum are shown in charts following the discussion of each property type.
Major markets
Beginning with the capital markets of each state (and Miami), overall market CRE indices, which combine the four property sector indices—industrial, multifamily, office, and retail—into one CRE index, are either in line with or below long-term market trends. In the third quarter, Richmond had the highest CRE index at 4.5, while Louisville had the lowest index of –39.2. About half of the markets (Richmond, Nashville, Birmingham, Charleston, Columbia, and Charlotte) had at least one property sector (mostly industrial) with at least some upward momentum. As noted in the more granular analysis below, the driving factors for the upward momentum in the industrial sector are strong construction forecasts and above-average rent growth.
Taking a deep dive
An important step in this analysis is determining which markets rank among the top markets with the strongest momentum in multiple property types. These markets, relative to their regional location, are of interest because they could indicate greater opportunities or greater risks. Of the 115 markets in the Southeast, 12 markets had at least two of the four property sectors ranked in the top 10 markets for strongest upward or downward momentum. The remainder of this analysis explores the similarities and differences between the various markets and property sectors, while considering the variation between market sizes within the region.
|
Market |
Upward Momentum Sector(s) |
Downward Momentum Sector(s) |
|
Augusta, Georgia |
Industrial, Multifamily |
|
|
Beckley, West Virginia |
Multifamily |
Retail |
|
Charlottesville, Virginia |
Industrial, Office |
|
|
Cleveland, Tennessee |
Multifamily |
Industrial, Office |
|
Elizabethtown-Fort Knox, Kentucky |
Industrial |
Retail |
|
Fayetteville, North Carolina |
Multifamily, Office, Retail |
|
|
Hattiesburg, Mississippi |
|
Industrial, Retail |
|
Hilton Head Island, South Carolina |
Industrial |
Multifamily, Office |
|
Homosassa Springs, Florida |
Multifamily, Office |
|
|
Huntsville, Alabama |
Industrial, Multifamily |
|
|
Knoxville, Tennessee |
Multifamily |
Office |
|
Lynchburg, Virginia |
Industrial |
Retail |
By Property Type
|
|
Industrial |
Multifamily |
Office |
Retail |
|
Upward Momentum |
- Augusta, GA - Charlottesville, VA - Elizabethtown- Fort Knox, KY - Hilton Head Island, SC - Huntsville, AL - Lynchburg, VA |
- Augusta, GA - Beckley, WV - Cleveland, TN - Fayetteville, NC - Homosassa Springs, FL - Knoxville, TN |
- Charlottesville, VA - Homosassa Springs, FL |
- Fayetteville, NC |
|
Downward Momentum |
- Cleveland, TN - Hattiesburg, MS |
- Hilton Head Island, SC |
- Cleveland, TN - Fayetteville, NC - Hilton Head Island, SC |
- Beckley, WV - Elizabethtown- Fort Knox, KY - Lynchburg, VA |
Industrial upward momentum
A strong construction forecast was the primary driver for upward momentum in the industrial sector, except for Lynchburg, Virginia. While not all markets are considered logistics hubs, the strength in construction falls in line with general industrial sector growth trends in the United States and the Southeast. These markets all had above-average levels of rent growth over the past two years but differed in terms of the trend—some markets have accelerating rent growth while others are decelerating. Vacancies are trending upward to varying degrees but generally remain well below long-term averages. (Again, the exception is Lynchburg, Virginia, which had historically high vacancies as of the third quarter.) These dynamics indicate early signs of possible oversupply of industrial space in the future if construction trends do not moderate.
Industrial downward momentum
Third quarter index values for Cleveland, Tennessee, and Hattiesburg, Mississippi, are the same, and the underlying variables reflect almost identical trends through November. Falling vacancy rates and a declining vacancy trend, a generally stable construction forecast, and above-average but moderating rent growth are expected through the remainder of 2020 and are driving the downward momentum. At less than 2 percent, these markets have some of the lowest vacancy rates—not just in the region, but in the country. Overall employment, as well as those in sectors using industrial space, has contracted notably as a result of the pandemic.

Multifamily upward momentum
All of the markets in this group have experienced very strong occupancy levels for at least the two most recent quarters, and data through November indicate a similar trend. Low mortgage rates are the main downward pull on momentum. Consumers are transitioning from multifamily into homeownership, when possible, to take advantage of more affordable financing options. A majority of these markets are experiencing modest rent growth, which has the potential to affect affordability if the trend continues into 2021.
Multifamily downward momentum
Hilton Head Island, South Carolina, is the only market with multiple strong momentum property sectors that has downward momentum in multifamily. Occupancy rates falling well short of historical trends and muted construction activity are contributing to the downward momentum in Hilton Head and other areas. As last month’s article noted, the CDC issued a moratorium on apartment evictions through the end of 2020 to prevent the further spread of COVID-19. If no other action is taken, occupancy levels in Hilton Head, as well as throughout the rest of the country, are likely to fluctuate notably as a result.

Office market in some metros showing upward momentum…
Upward momentum in Charlottesville, North Carolina, and Homosassa Springs, Florida, as well as the top 10 markets in the Southeast for the office sector, is mainly sustained by either heightened vacancy rates, strong construction forecasts, or both. The continuing work-from-home posture is not immediately producing widespread effects on the office market, but if the trend continues beyond the pandemic, it is possible that demand for office space may fall. However, it is important to note that office-using employment, though still down from a year ago, is rising. Southeast markets experiencing upward office momentum vary in size, and index values toward the bottom of the top 10 are similar to historical trends, implying that COVID-19 impacts to the office sector in the Southeast are minimal so far.
…but other metro areas’ office markets show downward momentum
In contrast to the areas with upward momentum, the markets (highlighted above) experiencing downward momentum in the office sector are generally seeing very low vacancy rates and minimal new construction. In keeping with the upward momentum markets, year-over-year office-using employment growth in these markets has pulled back. The pullback in new construction could mean that developers in these markets are taking a more conservative approach to new product. Although the outlook remains uncertain, the future of office employment could be a hybrid approach that combines in-person and remote-work opportunities for employees.

Retail upward momentum
Fayetteville, North Carolina, is showing upward trending vacancy rates in both strip center retail and malls. Retail sales growth fell through the first half of 2020 in the Southeast markets with the strongest upward momentum but is likely to rebound as the holidays approach, because retail sales fluctuate seasonally. As vacancies generally rise, rent growth is beginning to show signs of softening alongside construction forecast levels. Social distancing and safety measures implemented to combat COVID-19 have had a profound impact in the retail sector, and while the sector is adapting, online transactions continue to grow as a percentage of retail sales.
Retail downward momentum
The economic and real estate variables for the markets with downward momentum in the retail sector are overwhelmingly blue, visually speaking. In general, these markets have experienced below average vacancy rates for at least the past year, with moderate new construction. Throughout 2020, rent growth has moderated and data through November indicate a similar trend. These markets, mostly in the northern part of the Southeast, have weathered the storm of COVID-19 so far. A few markets have had a slight uptick in vacancy rates in November, potentially due to financial hardship, among other factors.

Tool update
The Atlanta Fed has enhanced the CREMI tool. Users of the U.S. Map view can now adjust the date of the index values shown on the map, allowing for over-time exploration of the United States as a whole. Similarly, the Ranking view also allows for the ability to adjust the date. Additional improvements to the tool are coming in 2021.
The CREMI will be updated monthly and will be accompanied by a discussion of results.


