Market overview: Top 10 most populous U.S. metro markets
When discussing national trends in commercial real estate (CRE), identifying overarching themes can make it easier to understand broader market behavior. The CRE Momentum Index (CREMI) tracks movements in specific variables (such as occupancy/vacancy rate, rent growth, and construction forecast) in local markets and provides a targeted view of real estate conditions.
This article focuses specifically on the 10 most populous U.S. metro markets, which are New York City, Los Angeles, Chicago, Dallas-Fort Worth, Houston, Miami, Philadelphia, Atlanta, Phoenix, and Washington, DC. This article refers to these areas as “target markets.”
Overview
The key descriptors of a market’s momentum are “upward” and “downward,” because different variables have different implications to the overall market movement, both individually and in combination with other variables. For example, by itself, a low vacancy rate could indicate a strong, well-occupied market. However, a low vacancy rate combined with unusually high rent growth and limited new construction could indicate a negative condition, such as potential undersupply or unaffordability of space. CREMI users can identify trends in markets and consider possible impacts.
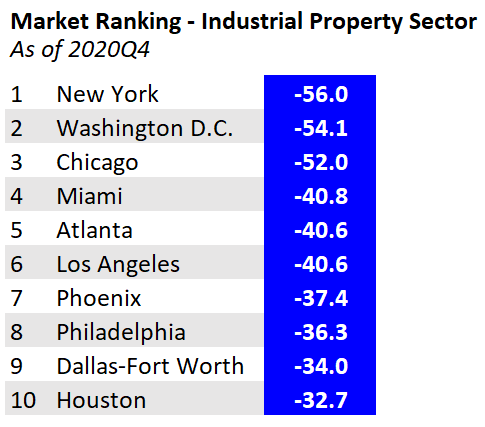
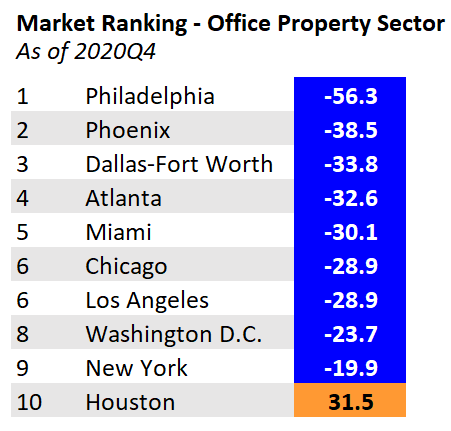
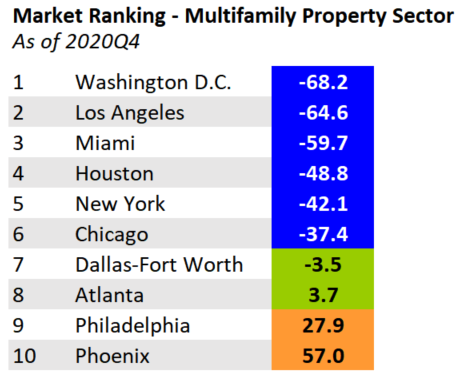
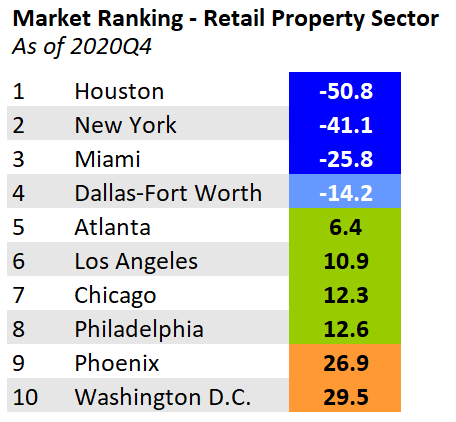
The CREMI interactive tool gives users a view of the markets with the strongest upward or downward momentum in each CRE property sector across the entire United States. By filtering the results to include only the target markets, the tool generates new graphics showing the market rankings for each property type. These graphics can be found below, following the discussion of each property type.

Market background
More than 85 percent of the U.S. population lives in a metro market, according to 2019 population estimates from the U.S. Census Bureau. More importantly, approximately 38 percent of the U.S. population lives in one of the target markets. These markets employ and house many consumers and attract domestic and international travelers and investors. The economic impact of these markets is profound, accounting for almost one-third of total U.S. gross domestic product through 2019, according to the U.S. Bureau of Economic Analysis. Data from the CREMI tool estimate that more than one third of the U.S. inventory across the four major property types—industrial, office, multifamily, and retail—is within these 10 markets, illustrating the importance of exploring trends and understanding nuances in this subset of markets. Comparison of the momentum trends in the target markets will provide perspective on emerging risks.
Overall results
Nine of the 10 target markets have overall CRE market indices indicating downward momentum. The exception is Phoenix, which is split between upward and downward momentum property sectors. Some of the most populous markets appeared in the national ranking for strongest momentum—specifically, downward momentum—across all property types in the fourth quarter of 2020. New York (fifth), Washington, DC (eighth), and Chicago (ninth) were among the national markets with the strongest downward momentum in the industrial sector. Washington, DC (sixth) also was among the strongest downward momentum markets for the multifamily space, along with Miami (eighth) and Los Angeles (tenth). Philadelphia was the strongest downward momentum market for the office sector. None of the target markets had the strongest momentum (in either direction) in the retail sector. (Boston had the greatest downward retail momentum, while Tyler, Texas, had the highest upward retail momentum.)
The following discussion details the specifics of each property sector, noting similarities and differences across the markets.
Industrial
As seen in the table below, the target markets in the United States all experienced steeper downward momentum in the industrial sector moving into the last quarter of 2020. The primary driver of this shift in momentum is the sharp decline in the construction forecast. Each of the target markets moved from upward momentum (in most cases, strong upward momentum) in the third quarter of 2020 to strong downward momentum in the fourth quarter of 2020. However, other metrics such as rent growth and vacancy rates vary somewhat. Generally, rent growth is slowing regardless of where the fourth-quarter momentum index falls. Industrial sector employment levels have strong downward momentum as well. Houston is the only market with heightened vacancy rates (strong upward momentum) as a result of notable deliveries of space to the market and a few company move-outs. Other markets as well are beginning to show an uptick in vacancies from the third to the fourth quarter. Industrial properties are expected to have the best chance to weather the challenges caused by the pandemic, so we will monitor the pullback in new construction and increase in vacancies in the coming months.

Office
In the office sector, nine of the 10 target markets (with the exception of Houston) experienced a steepening of downward momentum similar to what occurred in the industrial sector. The metric trends are quite symmetric across the nine markets. Once again, a sharp contraction in construction forecasts is pulling the markets’ momentum downward. Rent growth has slowed and vacancy rates are trending upward across the board. Houston stands out with the highest vacancy rates and upward vacancy trends—more than two and a half standard deviations above the mean—as lower oil prices and the pandemic have caused tenants to delay leasing decisions and large energy tenants have moved out. While office-using employment growth has been notably constrained in 2020, the growth rate is trending upward and employment levels continue to have very strong upward momentum, including in Houston. Although employment is moving upward, the work-from-home strategy adopted by companies to combat the spread of the pandemic is leading to less demand for space, creating the increase in vacancies. Business bankruptcies are either at or below the long-term average in every market except Houston, where above-average levels continue to rise. The business bankruptcy trend across the other markets is up marginally and is not indicating strain, ostensibly muted due to the Paycheck Protection Program.

Multifamily
The multifamily sector demonstrates more variation in momentum among the target markets. Seven markets are moving downward; Atlanta and Philadelphia are generally in line with overall long-term averages, and Phoenix has upward momentum. Across the country, multifamily demand is being affected as renters seek to take advantage of historically low mortgage rates and purchase homes. The direction of momentum in homeownership rates varies depending on the target market and local characteristics such as the supply of single-family homes and prices. (See the Atlanta Fed’s Home Ownership Affordability Monitor for a more in-depth analysis of the residential real estate market.) The target markets with strong downward momentum have very low occupancy levels that are continuing to worsen, even with the CDC’s eviction moratorium. As a result, rent growth has compressed and is expected to continue to fall. Fourth quarter construction values have yet to be released. Third quarter construction forecasts had significant downward momentum, similar to the office and industrial sectors. A similar contraction in multifamily will indicate overall commercial real estate construction is expected to slow notably.
In contrast to the seven target markets with overall downward momentum, Atlanta, Philadelphia, and Phoenix have healthy occupancy rates that are holding steady relative to historical trends. Rents are also on par with long-term averages and are increasing. Construction forecasts are generally trending downward, as are homeownership rates in these three markets. Particularly in Phoenix, occupancy rates and rent growth are well above the long-term average, which is partially the result of relatively affordable multifamily space when compared to other West Coast markets.

Retail
The retail sector is the most diverse in terms of momentum across the 10 target markets. Four of the markets are showing downward momentum, four are roughly in line with historical averages, and two are showing upward momentum. However, overall trends are similar across the markets, but differ based on magnitude. Vacancy rates at strip centers and malls are rising, with mall vacancy rates at historical highs. As has been the case with the other property types, construction forecasts have pulled back markedly in the fourth quarter across all markets. Rent growth is either at or below average, continuing a year-long trend of slowing. Social distancing and safety measures implemented to combat COVID-19 have had a profound impact on the retail sector, and the increase in vacancy rates and slowing of rent and new construction illustrate that the hardships are far from over. Phoenix and Washington, DC, have overall upward market momentum driven exclusively by the sharp increase in mall vacancy rates over the past year. Mall space makes up 7.1 percent and 12.5 percent of the total retail space in Phoenix and Washington, DC, respectively, and is about twice as high as the long-term average.

Conclusion
A majority of CRE property sectors in the most populous U.S. metro markets are experiencing downward momentum, an indication of tightening in various metrics, most notably construction forecasts. Industry concentrations fueling employment and geographic location are two important factors for driving market dynamics. The overall decrease in new construction in the major markets is now reflecting the uncertainty in the broader economy, after many projects were delivered through the end of 2020.
The CREMI will be updated monthly and will be accompanied by a discussion of results.


