
Background
The CRE Momentum Index (CREMI) provides easy access to various metrics for individual markets by sector and facilitates comparisons of conditions across markets. The index tracks movements in specific metrics (such as occupancy/vacancy rate, rent growth, and construction forecast) and provides a targeted view of real estate conditions in the industrial, multifamily, office, and retail sectors. Additional metrics, including employment and population growth, provide information specific to each sector, as appropriate. The CREMI derives a momentum index value for each sector within a market and also gives an overall momentum index value for the entire market.
The momentum of a metric is described as “upward” or “downward” based on its deviation from the long-term historical average of the market metric. In this context, upward doesn’t necessarily equate to improving conditions and downward doesn’t necessarily equate to deteriorating conditions. For example, by itself, a low vacancy rate metric could indicate a strong, well-occupied market. However, if the low vacancy rate is associated with unusually high rent growth and limited construction activity, the metric could be an indicator of market stress due to limited supply. Taken as a whole, the CREMI can enable us to make these kinds of determinations and better appreciate trends and conditions in markets.
In Focus: West South Central Census Division
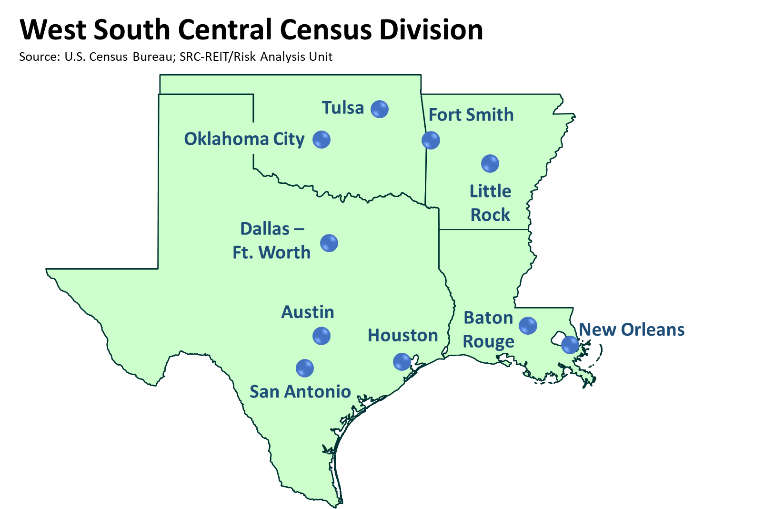
This month’s CREMI update covers markets in the Census Bureau’s U.S. West South Central (WSC) Census Division, which includes Arkansas, Louisiana, Oklahoma, and Texas. The WSC markets analyzed were selected based on population. In the most populous states, all markets with a population greater than 1 million were reviewed. In less populous states, the two largest markets were analyzed.
Major West South Central Markets
| Arkansas | Louisiana | Oklahoma | Texas |
| Fort Smith | Baton Rouge | Oklahoma City | Austin |
| Little Rock | New Orleans | Tulsa | Dallas-Fort Worth |
| Houston | |||
| San Antonio |
Any market, regardless of size, that ranked highest in the region in terms of upward or downward momentum in a property sector was also included to provide a complete perspective on market conditions.
Results: Summary Market indices
Using the data available as of February 1, the Summary Market CRE indices—which are based on data from the industrial, multifamily, office, and retail sectors—generally show downward momentum across WSC markets, which indicates the values of most metrics were trending below long-term averages. In the fourth quarter of 2020, eight of the 10 major markets had CRE indices below zero, indicating downward momentum. (The index values can range from 0 to over 100, or extreme.) Fort Smith, Arkansas, posted the highest overall CRE index at 14.6, while New Orleans, Louisiana, had the lowest overall index at –29.8.
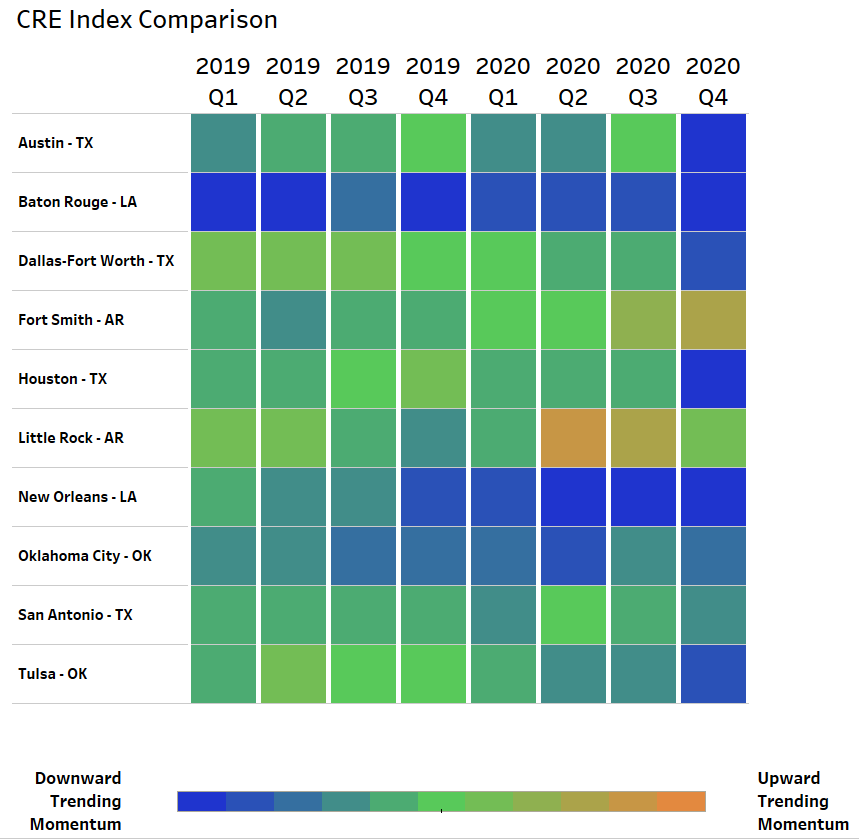
Diving deeper
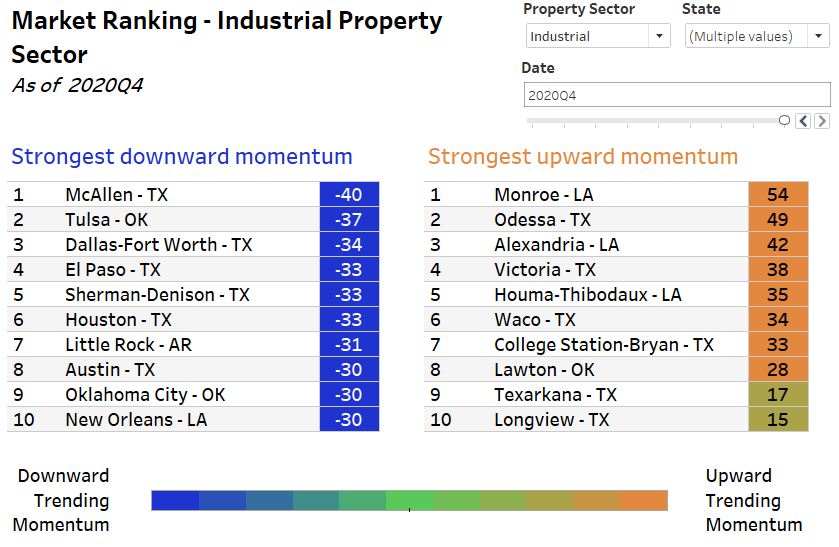
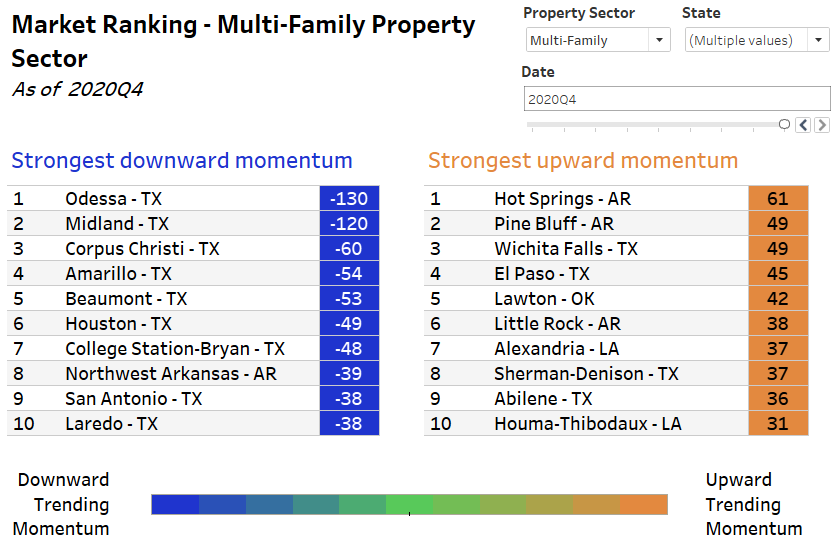
In addition to the 10 largest WSC markets, smaller metros that displayed the strongest momentum in three or more property types were included in this review. Of the 44 markets in WSC, 24 markets showed the strongest upward or downward momentum in at least three property types. While property sectors in the major markets generally had more downward momentum, sectors in the smaller markets typically had more upward momentum, as the tables below show.
| Major Markets | Upward Momentum Sector(s) |
Downward Momentum Sector(s) |
Austin, TX |
Industrial, Retail |
|
Baton Rouge, LA |
Office, Retail |
|
Dallas-Fort Worth, TX |
Industrial, Office |
|
Fort Smith, AR |
Office, Retail |
|
Houston, TX |
Industrial, Multifamily, Retail |
|
Little Rock, AR |
Multifamily |
Industrial |
New Orleans, LA |
Industrial, Office, Retail |
|
Oklahoma City, OK |
Industrial |
|
San Antonio, TX |
Retail |
Multifamily |
Tulsa, OK |
Industrial, Office |
|
Smaller Markets with at Least 3 Ranked Property Types |
Upward Momentum Sector(s) |
Downward Momentum Sector(s) |
Amarillo, TX |
Office, Retail |
Multifamily |
College Station, TX |
Industrial, Office, Retail |
Multifamily |
El Paso, TX |
Multifamily |
Industrial, Office |
Lawton, OK |
Industrial, Multifamily, Office, Retail |
|
Midland, TX |
Office, Retail |
Multifamily |
Odessa, TX |
Industrial, Retail |
Multifamily |
Waco, TX |
Industrial, Office, Retail |
By Property Type
|
Industrial |
Multifamily |
Office |
Retail |
|
|
Upward Momentum |
College Station, TX Lawton, OK Odessa, TX Waco, TX
|
El Paso, TX
Lawton, OK Little Rock, AR |
Amarillo, TX
College Station, TX
Fort Smith, AR
Lawton, OK
Midland, TX Waco, TX |
Amarillo, TX
College Station, TX
Fort Smith, AR
Lawton, OK
Midland, TX
Odessa, TX
San Antonio, TX Waco, TX |
|
Downward Momentum |
Austin, TX
Dallas-Fort Worth, TX
El Paso, TX
Houston, TX
Little Rock, AR
New Orleans, LA
Oklahoma City, OK Tulsa, OK |
Amarillo, TX
College Station, TX
Houston, TX
Midland, TX
Odessa, TX San Antonio, TX |
Baton Rouge, LA
Dallas-Fort Worth, TX
El Paso, TX
New Orleans, LA Tulsa, OK |
Austin, TX
Baton Rouge, LA
Houston, TX New Orleans, LA |
The remainder of this update explores the similarities and differences between WSC markets in each of the four property sectors.
Industrial Sector
The CREMI measures Industrial Market Momentum based on vacancy rates and trends, rent growth, construction forecasts, nonstore retail sales growth, and transportation and warehousing employment growth.
Downward Industrial Momentum
Historically low vacancy rates were the tipping point for most markets with downward industrial momentum in the fourth quarter of 2020. Markets with downward momentum tended to have either stable or slowly increasing vacancies through the quarter. Rent growth softened in these markets, particularly in Houston, which was the only market with elevated vacancy rates throughout 2020, increasing by almost 250 basis points year-over-year. Overall, the historically low vacancy rates across a majority of the markets with downward industrial momentum have not yet spurred notable growth in rents, construction, or employment, which could bring upward momentum.
A sharp contraction in the second, third, and fourth quarters in year-over-year transportation and warehousing employment growth reflects the impact of COVID-19 on broader employment trends across the United States. In the WSC, Little Rock, Houston, and El Paso appear to have recovered quickly, bouncing back to the long-term average industrial-using employment rate, at a minimum.
Upward Industrial Momentum
Markets with the strongest upward industrial momentum experienced significant increases in vacancy rates throughout 2020, reflecting stress in the market. However, rent growth in these markets is at or just above the historical trend, which could indicate that stress may not be as cumbersome as the single vacancy data point indicates. Construction forecasts in Lawton, Odessa, and College Station remain negligible, while in Waco—which is experiencing a renaissance—current space under construction stands at almost 10 percent of existing inventory. In markets with the strongest upward industrial momentum, employment levels weathered the storm of COVID-19 in the second and third quarters better than other markets in the West South Central region. These markets may be adjusting to a new normal, which could be a function of more movement of companies, workers, and space in the industrial sector.
Multifamily Sector
The CREMI measures Multifamily Momentum based on occupancy rates and trends, rent growth, construction forecasts, homeownership rates, mortgage rates, and population growth.
Downward Multifamily Momentum
All of the markets experiencing downward multifamily momentum saw a decline in occupancy in 2020. More broadly, larger U.S. cities have generally seen a decline in occupancy levels as people have migrated out of the urban core due to conditions caused by COVID-19. This pullback in demand has resulted in generally soft rent growth. This trend is most notable in Odessa and Midland, Texas, where rent growth declined by year-over-year double-digit percentages through December. These areas were under strain before the pandemic due to the drop in oil and gas prices. Historically low mortgage rates have made it possible for some renters to purchase homes. As the homeownership rate improves, apartment occupancy may decline further. Uncertainty remains in multifamily markets, particularly with regard to the extension of eviction moratoria.
Upward Multifamily Momentum
While other markets experienced downward pressure on occupancy levels, occupancy is robust in markets with upward momentum. Smaller U.S. cities are not seeing the same out-migration from the urban core but, rather, the opposite migration flow. Rent growth is gaining strength in these markets as competition for space arises. Construction forecasts are subdued, which could constrain supply going forward, leading to further increases in occupancy levels and rent growth.
Office Sector
The CREMI measures Office Momentum based on vacancy rates and trends, rent growth, construction forecasts, office-using employment and growth, and business bankruptcies.
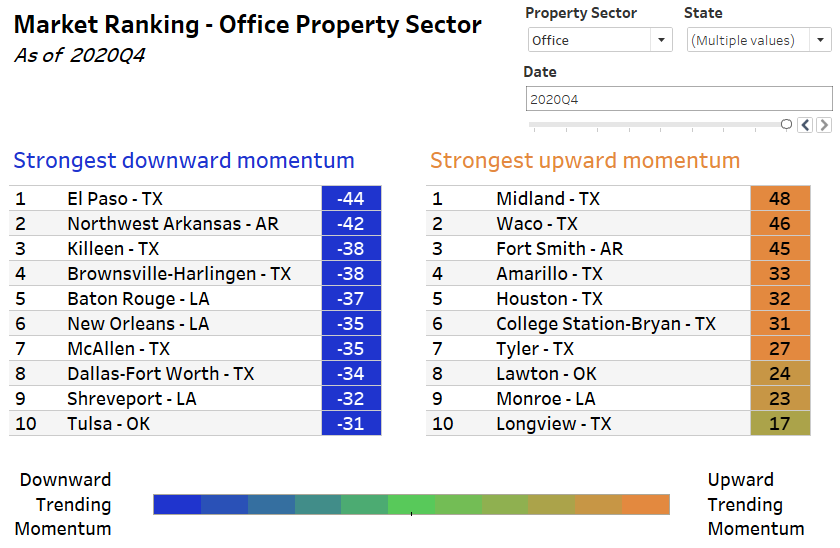
Downward Office Momentum
Stable rent growth, slowing office-using employment growth, and increasing vacancies are the defining trends in markets with downward office momentum. Although the pandemic has caused a substantial decline in the use of office space, market impacts have been muted, given the longer-term nature of leases. While continuing work-from-home arrangements are not immediately producing widespread effects on the office market, if the trend continues beyond the pandemic, demand for office space may fall, which could push vacancy rates to new heights. It is important to note, however, that office-using employment in WSC is rebounding faster than the nation.
Upward Office Momentum
Like the areas with downward momentum, markets experiencing upward momentum are also seeing increases in vacancy rates. But prior to the pandemic, these areas generally had rates that were well above long-term averages. This historical strength is maintaining upward momentum in the office sector for now.
Retail Sector
The CREMI measures Retail Momentum based on strip center vacancy rates and trends, rent growth, construction forecasts, mall vacancy rates and trends, retail sales growth, and nonstore/total retail sales.
Downward Retail Momentum
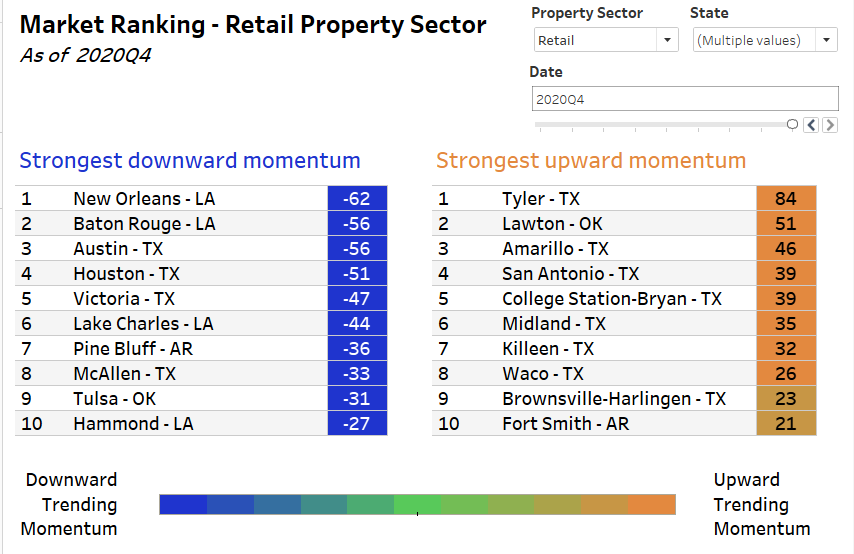
The economic and real estate variables for the markets with downward momentum in the retail sector are overwhelmingly blue, visually speaking, indicating greater negative deviation from long-term historical averages. Vacancy rates were below respective market averages through the end of 2020, although some stabilization occurred in the last few quarters. Rent growth softened marginally in the second half of last year. Construction forecasts have weakened, a trend common across the country, as the future of retail is challenged not only by the pandemic, but also by continued technological changes that affect how and where consumers purchase goods.
Upward Retail Momentum
Elevated mall vacancy rates are consistently present throughout this group of WSC markets. Rent growth softened marginally going into the end of 2020 but remains in line with historical averages. Construction forecasts have generally flattened, with fewer projects under development. Social distancing and safety measures implemented to combat COVID-19 have had a profound impact on the retail sector, and while the sector is adapting, online transactions continue to grow as a percentage of retail sales.
Tool update
The Atlanta Fed has enhanced the CREMI tool. Users of the Market Ranking view can now adjust the state(s) shown in the ranking, allowing for state- or region-specific analysis in addition to the United States as a whole. There is a new view, CRE Index Comparison, which allows users to compare CRE index values of different markets side by side. Additional improvements to the tool are coming in 2021.
The CREMI will be updated monthly and will be accompanied by a discussion of results.


