
What is CREMI?
The Commercial Real Estate Momentum Index (CREMI) provides easy access to various metrics for individual markets by sector and facilitates comparisons of conditions across markets. The index tracks movements in specific metrics (such as occupancy/vacancy rate, rent growth, and the construction pipeline) and provides a targeted view of real estate conditions in the industrial, multifamily, office, and retail sectors. Additional metrics, including employment and population growth, provide information specific to each sector as appropriate. CREMI derives a momentum index value for each sector within a market and gives an overall momentum index value for the entire market. Upward and downward momentum correspond with aggregated trends in the market metrics, not necessarily indicating "good" or "bad."
What’s New with CREMI?
Be sure to explore the tool’s newest feature under the Retail Analysis tab. This graph shows how markets’ retail vacancy rates change over time relative to predefined vacancy rate ranges. Read on to see how this information was used to assess the health of the retail mall segment.
Every month we explore another aspect of the information the Commercial Real Estate Momentum Index (CREMI) provides and what it can tell us about commercial real estate conditions. This month, we’ll focus on mall space in the retail sector. Variables that go into the retail momentum index include vacancy rates, vacancy trends, rent growth, construction forecasts, and retail sales growth. To gauge e-commerce activity, it also provides information on nonretail and retail sales. Our look at conditions in the mall space will focus on vacancy rates, including the effect of the COVID-19 pandemic, and we provide a note about prospects for repurposing retail mall space.
Retail vacancies trending upward
The national retail (all retail) vacancy rate has drifted upward since late 2018 (see the chart). By the first quarter of 2021, the all retail vacancy rate stood at 5.1 percent. However, recent trends by property subtype vary widely, ranging from a low of 3.2 percent (general retail) to a high of 7.9 percent (neighborhood centers).

Mall vacancy rates rising faster than other subgroups
Mall vacancies began rising in mid-2017, before overall retail sector rates increased (see the chart). In the 15 quarters since the 2017 low point of 3.7 percent, mall vacancy rates have almost doubled and are estimated to be 6.9 percent as of the first quarter of 2021, according to Costar. This subgroup has experienced significant stress from the development of e-commerce and changes in consumer shopping preferences and has seen the sharpest increase in vacancies during the COVID-19 pandemic.
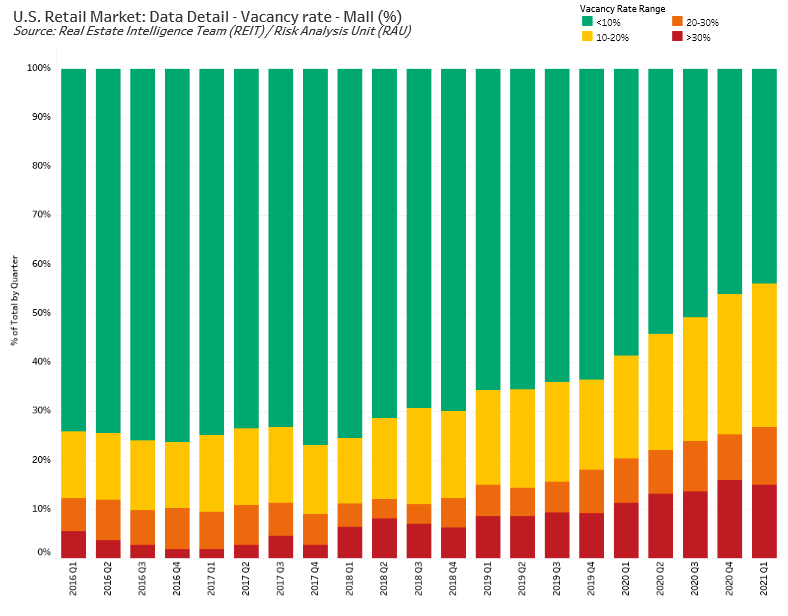
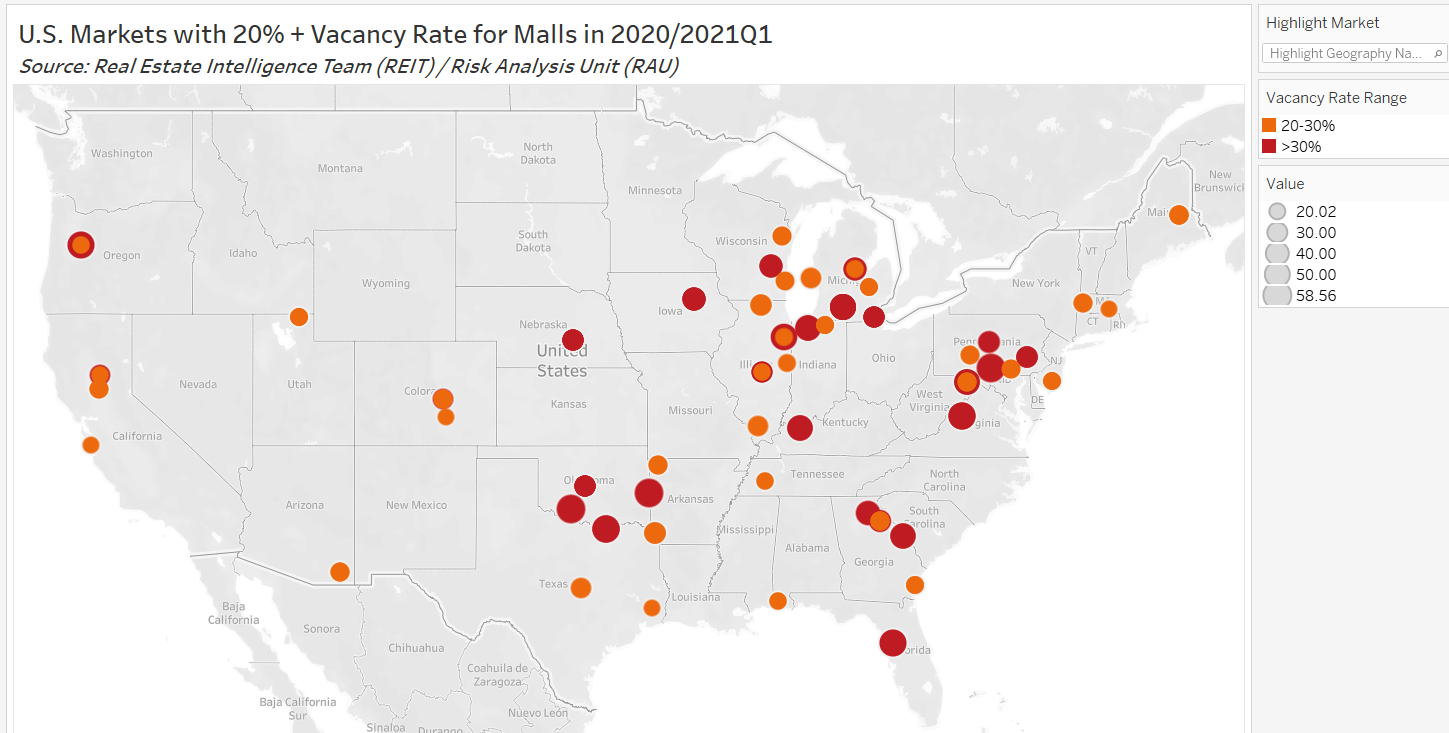
Of the more than 390 markets covered by CREMI, 43 have current mall vacancy rates of 20 percent or more (see the chart). The mall sector in general has experienced greater headwinds. The percentage of markets with low vacancy (less than 10 percent) has gone from over 70 percent to less than 50 percent since the first quarter of 2016, and the percentage with vacancy rates over 30 percent has roughly tripled over the five-year span. Generally, markets where mall vacancy rates are highest are found in the nation’s secondary and tertiary markets, some of which have declining or negative population growth, a negative indicator for real estate conditions. High delinquencies in certain markets in Texas, Oklahoma, and Arkansas may be related to volatility in energy prices. Although energy prices have rebounded, reduced production hurt local economies and most likely affected retail purchasing power.
E-commerce places stress on retail
The development of technology-driven e-commerce broadened the marketplace for consumers and retailers at particular expense to mall properties. Online shopping expands consumers’ retail options, increasing the inventory available for purchase while providing at-home shopping comfort and greater efficiency of delivery and returns. Online retail also expands merchants’ options as it allows them to reach customers without maintaining costly store space, putting traditional brick-and-mortar retailers at a competitive disadvantage.
E-commerce developments also contributed to the ongoing deterioration in some mall tenants’ financial condition, which has had a negative effect on mall occupancy. Traditional retailers unable to readily adapt websites for online shoppers suffered even more. Poor financial management led to consolidation of operations for some retail firms and liquidation for others, reducing the pool of potential tenants and the foot traffic they would have attracted. (See the sidebar to learn more about retail trends among U.S. metro areas.)
What Do CREMI Market Rankings Say about the Retail Sector?

You’ll note that some of the markets identified as having the strongest upward momentum appear on the high delinquency map above. In this instance, strong upward momentum does not equate to improving conditions. Rather, it refers to the direction of the movement of the variables considered when determining the index rating. For example, consider the retail vacancy rates for the market with the strongest downward momentum, Bellingham, Washington, to metrics for York, Pennsylvania, the market with the strongest upward momentum. Bellingham is the stronger retail market.
|
Retail Vacancy Momentum Comparison |
||
|
Market |
Bellingham, Washington |
York, Pennsylvania |
|
Vacancy (mall) |
0.87 percent |
25.92 percent |
|
Vacancy (strip mall) |
2.39 percent |
20.65 percent |
Pandemic affects mall properties
According to Placer.ai’s Mall Index, which tracks the foot traffic at more than 50 top-tier malls, 2020 mall visits peaked in February, with a 10.7 percent year-over-year increase, before bottoming out in April, falling by 95.5 percent year over year. Traffic improved through October, when visits were down only 29.3 percent from the prior year, then declined in November by 42.2 percent year over year due to the second wave of COVID-19 cases. Traffic picked up again in December, down 32.4 percent from the prior year. March 2021 Placer.ai data indicated that foot traffic was up by 86 percent year over year. However, this year-over-year comparison reflects the first COVID lockdown in March 2020. A comparison with March 2019 shows traffic is only down by 23.9 percent, the lowest year-over-year gap since the pandemic began.
The chart below shows a divergence between non-store retail sales growth and retail sales growth, roughly corresponding to the onset of the pandemic, when initial closures of all but essential businesses (which did not include most mall stores) and the implementation of social distancing requirements occurred. It’s not clear, however, if this response to the pandemic accelerated the demise of in-person shopping. In fact, the percentage of non-store sales/total retail sales, a measure of online commerce, is relatively stable. Also, as stores reopened in the third quarter of 2020, non-store retail sales growth dropped while overall retail sales grew, possibly due to pent-up demand for interactive, in-person experiences.

Continued challenges for mall properties
It is unclear if the recent burst of enthusiasm for mall visits will continue, or if pandemic shopping habits will persist long term, further accelerating malls’ troubles. If other pandemic-related trends continue and result in structural demographic changes, such as continued relocation away from urban centers, close-in luxury malls, which have held up comparatively well, may also lose ground.
Rethinking mall space
While traditional retail mall prospects have dimmed, redevelopment projects are under way across the country. Mall properties are usually centrally located with good access to transport, ample flexible interior space, and plenty of exterior space for parking, making them good candidates for redevelopment as local zoning permits. Given necessary capital, properties can be repurposed for warehouse and distribution use, medical centers, schools, sports complexes, entertainment venues, and office and residential projects. As an example, during the past three years, Amazon has purchased dozens of malls and acquired or leased anchor spaces that have been repurposed for distribution.
If the pandemic results in structural changes that shift office and residential demand, all of these projects may not be workable. In the short term, COVID-related uses for vacant space have popped up, with malls providing space for vaccination centers and “ghost kitchens,” where multiple delivery kitchens operate out of one location, improving efficiency for delivery drivers.
Let’s talk more about CRE
We’ve heard from some CREMI users in recent weeks, and we invite further conversation. What does CREMI tell you about your market and its net absorption rates? What issues would you like us to spotlight in future updates? Would you participate in a monthly survey of CRE market conditions? To facilitate more direct communication, we have a new email address: CREMI@atl.frb.org. Please keep in touch.


Lauren Terschan, senior data analytics and real estate specialist, and Brian Bailey, a subject matter expert in the Real Estate Intelligence Team/Risk Analysis Unit, both in the Atlanta Fed’s Supervision, Regulation, and Credit Division