The Commercial Real Estate Momentum Index (CREMI) provides easy access to various metrics for individual markets by sector and facilitates comparisons of conditions across markets. The index tracks movements in specific metrics (such as occupancy/vacancy rate, rent growth, and the construction pipeline) and provides a targeted view of real estate conditions in the industrial, multifamily, office, and retail sectors. Additional metrics, including employment and population growth, provide information specific to each sector as appropriate. CREMI derives a momentum index value for each sector within a market and gives an overall momentum index value for the entire market. Upward and downward momentum correspond with aggregated trends in the market metrics, not necessarily indicating "good" or "bad."
Be sure to explore the tool’s newest feature under the U.S. Map tab. In addition to selecting a property type to view, users can select a specific variable to explore a national snapshot of variable trends. Also, on the Bell Curve view, hovering over a particular market will show the market’s momentum index breakdown, allowing users to explore what's driving the property type index alongside other markets.
Every month we explore another aspect of the Commercial Real Estate Momentum Index (CREMI) and how it can inform us about commercial real estate conditions. This month we’ll explore dynamics that have allowed the industrial sector to remain balanced despite the past year’s economic hardships. Variables that create the industrial momentum index include vacancy rates, vacancy trends, rent growth, construction forecasts, nonstore retail sales growth, and employment growth in transportation and warehousing.
National industrial sector overview
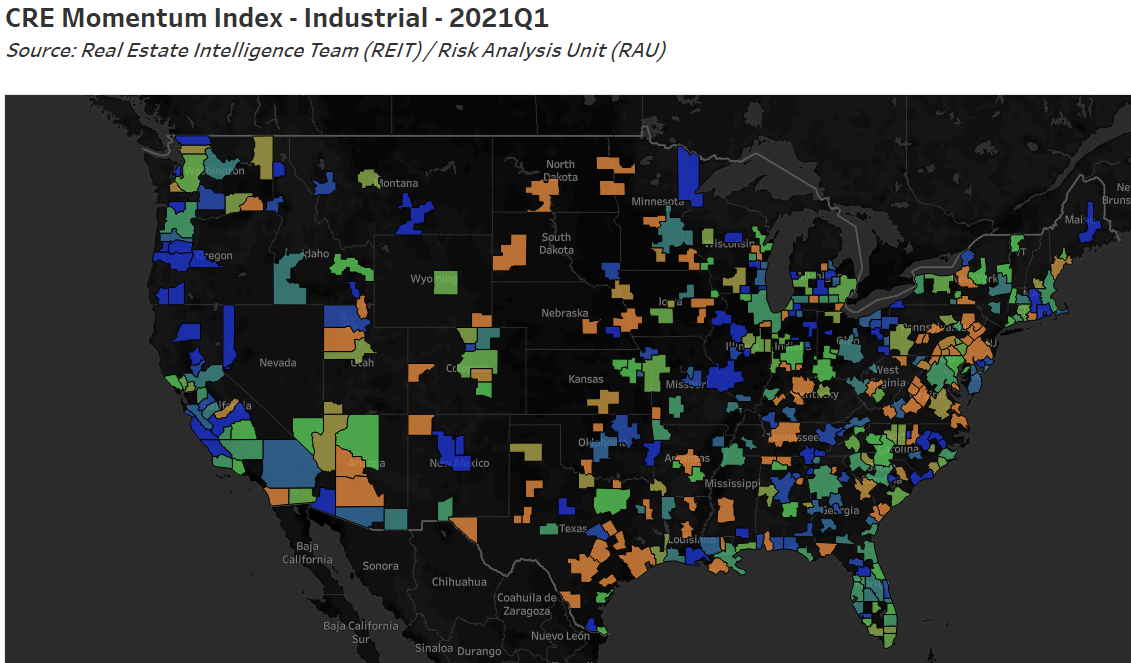
Industrial sector data for the first quarter of 2021 does not immediately reflect distinct trends in sector dynamics across the United States. The 390 markets tracked in CREMI are quite evenly distributed across the momentum index spectrum (see the chart). We further explore conditions in the industrial sector to tease out other national tendencies or similarities in the underlying variables.


Industrial markets maintain strong vacancy rates…but risk is growing
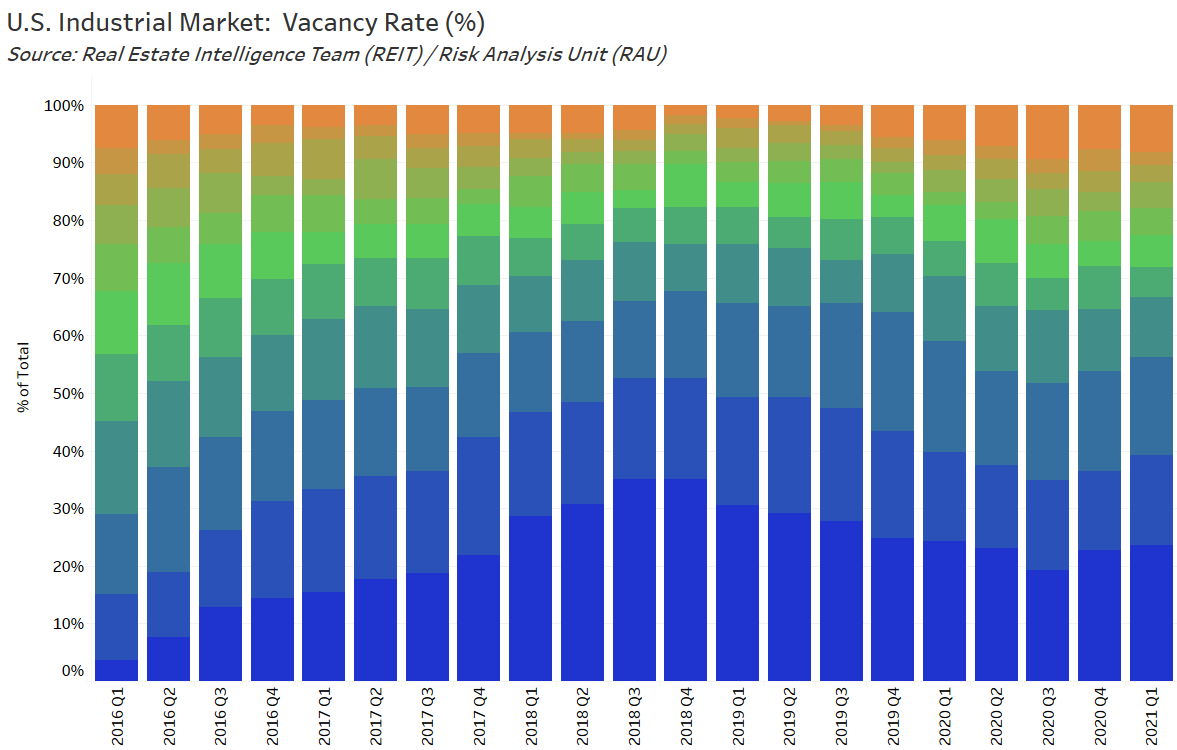
U.S. industrial space continues to be in high demand. For the past five years, more than half of the CREMI markets experienced industrial vacancy rates below long-term norms. Per CREMI’s methodology, long-term averages span 20 years of historical data, relative to each market, property type, and variable. As of the first quarter of 2021, 294 markets (75 percent) had vacancy rates below long-term norms and contributed to a very hot property segment. However, the trend has been moderating somewhat compared to levels experienced a couple of years ago. Part of the driver has been new construction, as net completions have outstripped absorption consistently over the last several quarters, leading national vacancy rates to rise. While past trends in the e-commerce space have radically altered the delivery of goods to the consumer, the effects may not be as notable in the future.
National trends in industrial vacancy rates over time reflect the percentage of markets at each level of momentum (see the chart), with the most distinct orange and blue colors representing the largest deviation from market norms. In comparing the vacancy rate alongside the vacancy trend, the six-quarter rolling average of the vacancy rate, CREMI suggests that a continued uptick in vacancies may continue to emerge. A sizeable portion of the change in momentum is due to excessive amounts of construction in the pipeline.


E-commerce stresses retail, supports industrial space
Last month, we explored the stress placed on the retail sector, particularly malls, by technology-driven e-commerce platforms. During the pandemic, online shopping has expanded consumers’ purchase options while providing shopping ease at home or on a mobile device and greater efficiency of delivery and returns. Similarly, e-commerce expands merchants’ options as it allows them to reach a broader customer set. This dynamic has supported growth in demand for industrial space across the country. In early 2016, the median industrial CREMI market size was 17.2 million square feet (SF). Five years later, the median market size had expanded to 18 million SF, adding approximately 1 percent more space each year.
Rent growth and construction forecasts trending toward historical norms
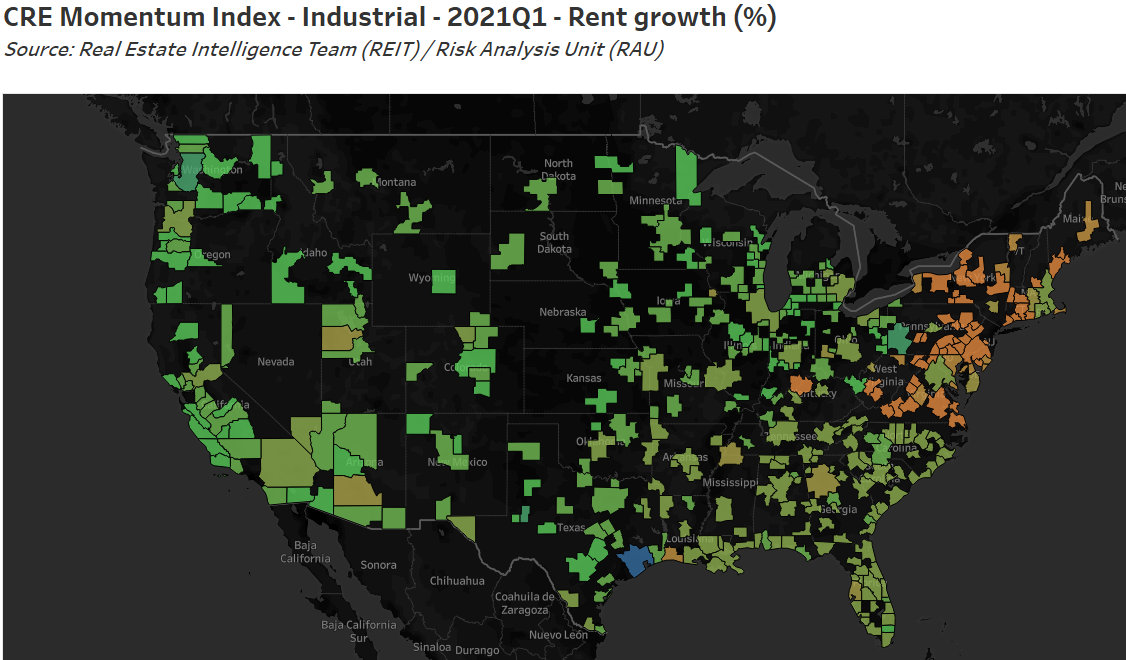
Although still above norms, U.S. industrial rent growth is trending toward long-term averages. Construction forecasts are following a similar pattern, though a handful of markets are moving above long-term averages. A snapshot of industrial rent growth in the first quarter of 2021 (see the chart) uncovers a clear divergence between Northeast markets and the rest of the country. Rent growth in the Northeast has generally remained higher than elsewhere for the past six quarters. The Northeast has been able to maintain these elevated rent levels, particularly as some coastal markets haven’t experienced increases in inventory, allowing for competitive pricing pressures to remain in the region. Houston also diverges as the only market with rent growth lower than it has historically seen. Houston experienced a sharp decline from the first to the second quarter of 2020 as the pandemic emerged in the United States, and that trend has continued.

Impacts of COVID-19 on the industrial sector
Despite the increase in e-commerce, reflected by year-ago nonstore retail sales growth, labor market shocks resulting from social distancing and other measures taken to slow the spread of COVID-19 negatively affected the industrial sector. The sharp contraction in year-over-year transportation and warehousing employment growth in the second quarter of 2020 contrasted with the spike in e-commerce sales (see the chart). While less distinct, rent growth and absorption rates slowed as vacancies increased by 57 basis points from the fourth quarter of 2019 to the third quarter of 2020.

Let’s talk more about CRE
We’d like to hear from you. What does CREMI tell you about industrial conditions in your market? What are you seeing in terms of industrial and warehouse development? Are there issues that you would like us to spotlight in future updates? Are you interested in participating in a monthly survey of CRE market conditions? To facilitate communication, we have a new email address: CREMI@atl.frb.org. Please keep in touch.
Lauren Terschan, senior data analytics and real estate specialist, and Brian Bailey, a subject matter expert in the Real Estate Intelligence Team/Risk Analysis, both in the Atlanta Fed’s Supervision, Regulation, and Credit Division


