
What is CREMI?
The Commercial Real Estate Momentum Index (CREMI) provides easy access to various metrics for individual markets by sector and facilitates comparisons of conditions across markets. The index tracks movements in specific metrics (such as occupancy/vacancy rate, rent growth, and the construction pipeline) and provides a targeted view of real estate conditions in the industrial, multifamily, office, and retail sectors. Additional metrics, including employment and population growth, provide information specific to each sector as appropriate. CREMI derives a momentum index value for each sector within a market and gives an overall momentum index value for the entire market. Upward and downward momentum correspond with aggregated trends in the market metrics, not necessarily indicating "good" or "bad."
August 2021 Spotlight: Retail’s Promise and Challenges
Every month, we explore a different aspect of the Commercial Real Estate Momentum Index (CREMI) and how it can inform us about the commercial landscape. This month, we'll focus on retail indicators and how the sector has evolved during the pandemic. There are many, many variables that affect the retail momentum index. A few of the more notable ones these days include excess retail space, labor shortages, and e-commerce trends.
National retail sector overview
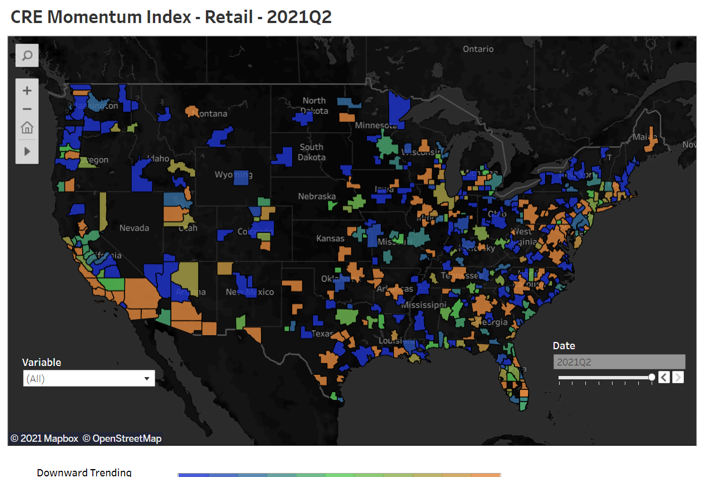
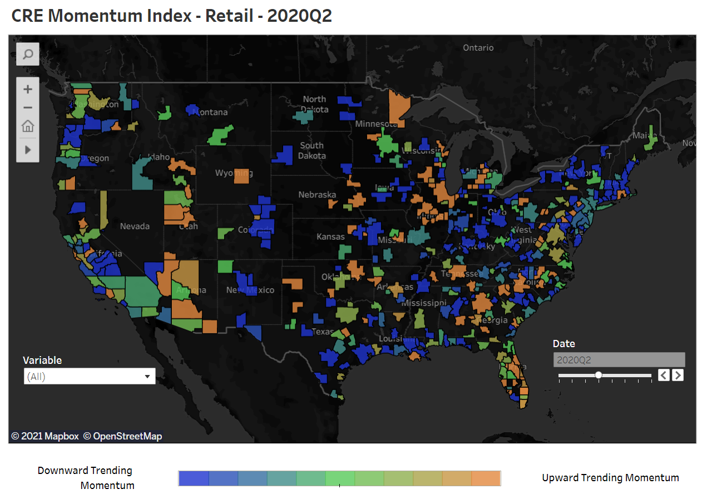
The US retail sector continues to experience mixed results because of a myriad of elements including shifting population trends, too much space, changing consumer buying habits, and evolving technology. The national CREMI results for retail indicate minimal change in activity as a whole between July 2020 and July 2021. This can be seen by comparing the US map graphics (see below) for these periods.
While the overall national results are generally unchanged, effects at the local level are much more pronounced. In some markets, such as those in the Southeast, mid-Atlantic, and southern West Coast, accelerating momentum indicates a resurgence in activity. On the other hand, areas like the Northwest, Texas Gulf Coast, upstate New York, and the Midwest remain muted. In the Northwest and Midwest, activity has declined from a year ago. Individually, markets such as Atlanta; Charlotte, North Carolina; Nashville, Tennessee; Pittsburgh; and San Antonio continue to show upward momentum. Austin, Texas; Houston; Las Vegas; Memphis, Tennessee; and Seattle are experiencing slowing activity. By contrast, the CREMI for retail shows a rebound in markets that were most depressed by COVID-19 restrictions, such as Chicago, New York, Los Angeles, Dallas/Fort Worth, and Washington, DC.
Retirees often move from higher-cost markets to lower-cost areas with moderate weather. As technology enables workers and businesses to be more mobile, reducing the friction associated with such transfers may accelerate movement to lower-cost markets. As work-from-home popularity has increased, relocation to areas with a lower cost of living has helped strengthen retail markets in Atlanta and Phoenix. The move to the suburbs and more affordable regions has hurt the retail sector in markets with a higher cost of living. Shifting populations and business models can create local imbalances, which leads to outcomes such as excess space and a need to repurpose functionally obsolete retail properties. However, these same dynamics could also spur opportunities for new development in markets benefiting from in-migration.
Too much retail space and changing uses
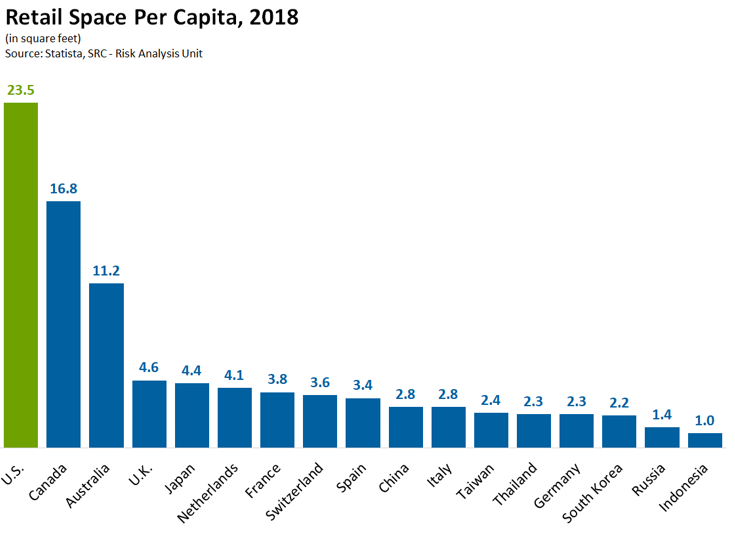
According to the International Council of Shopping Centers, the United States has roughly 23 retail square feet per capita, significantly more than similar consumer-based economies such as in Australia, Canada, Germany, and the UK. The United States surpasses each of them in retail space, having close to six times the amount that Germany has.
The abundance of space is negatively affecting retail. The United States has built a significant amount of retail space since the 1960s to satisfy the growth of the consumer economy and demands for convenience and breadth of choice. The first enclosed US mall, Southdale Shopping Center in Edina, Minnesota, was built in the late 1950s. One would expect that over time, consumer buying habits could shift and affect space needs. Changes in personal purchasing practices were taking place and accelerated by technological advances. Enhanced technology has enabled greater efficiency and raised concerns about the future of retail space. However, shopping areas are not the only segment affected by this trend.
Vacancy rates show mixed bag
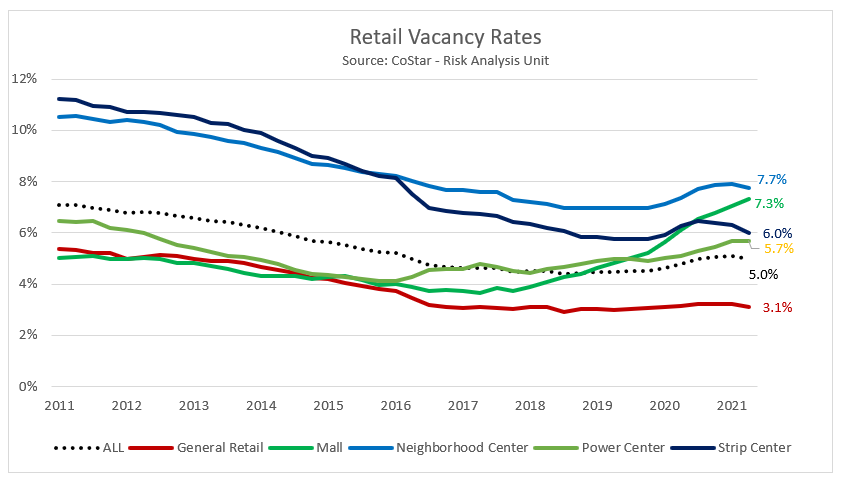
Retail was particularly hard-hit by the pandemic and has shown a bifurcation in performance during the recovery. Fortunately, the vacancy rate for all the sectors (except malls) are well below their 2011 levels. Following a general trend upward in 2020, the average vacancy rate has begun to decline and return toward prepandemic levels. Across the retail segments, there are mixed results. Some sub-property types—strip centers and neighborhood centers—are showing improvement, while others such as malls and big-box centers continue to face significant challenges. Part of the reason for the disparity in performance is tenant makeup. Grocery space has been traditionally more resilient to the impact of e-commerce and has stabilized the surrounding service in shopping centers. In recent years, grocery has seen continuing growth in online food purchases. Further amplified by social distancing measures, the profitability and effectiveness of e-commerce has been an increasing priority in the grocery industry. E-commerce sales (through at store pickups) still drive consumers to their local grocery-anchored shopping centers, which also benefits surrounding tenants. Strip and neighborhood centers typically have a higher percentage of restaurants that derive a larger portion of sales from takeout and providers of services compared with malls. Another differentiator is that malls and big-box centers traditionally have a higher percentage of retailers that sell goods, and those stores have suffered as e-commerce changed consumer shopping habits.
Good and bad news on vacancy rates
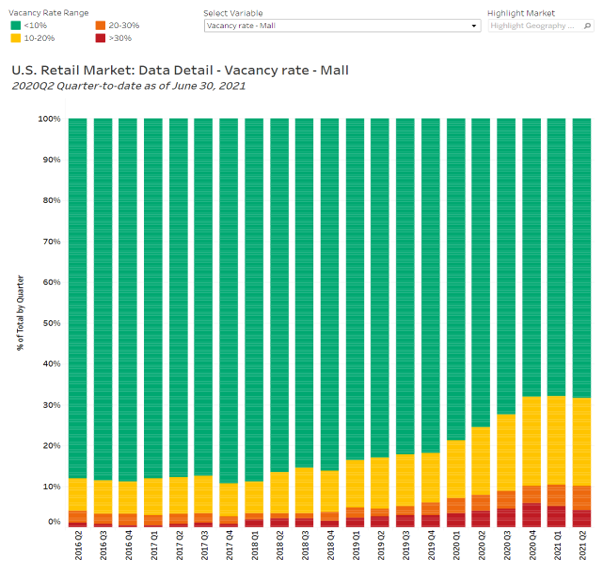
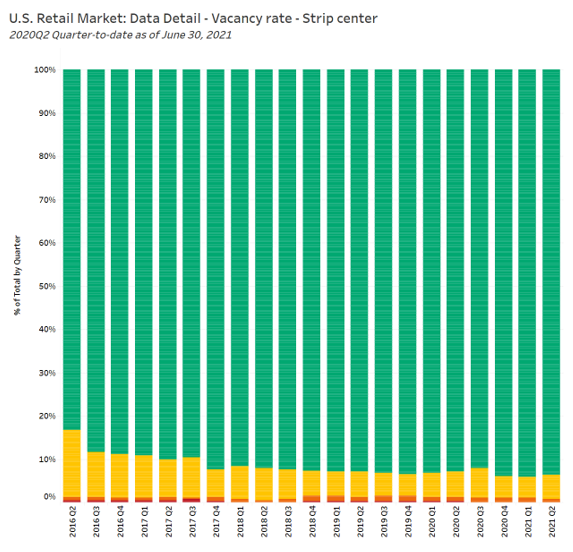
The charts above illustrate vacancy rates for both malls and strip centers as a percentage of the total number of properties. (Red indicates properties with vacancy rates greater than 30 percent; the orange shading signifies 20 percent to 30 percent vacancy; yellow represents a vacancy rate of 10 percent to 20 percent; and green is less than 10 percent). The charts showcase the difference in performance between malls and strip retail. Historically, malls have had a concentration of retailers (especially apparel) whose customers have become prime targets for e-commerce businesses. E-commerce sales have eaten into the business of mall retailers. In some good news for malls, the chart shows the percentage of properties with greater than 30 percent vacancy peaked in the fourth quarter of 2020. Moreover, the percentage of strip retail properties that have a vacancy rate above 10 percent appears comparable to conditions in 2019, before the pandemic. The percentage of strip retail properties with vacancy rates above 10 percent has declined compared with 2016. Vacancy rates for strip centers have remained relatively stable and fared well through the pandemic.
Evolution of retail delivery
To enhance the customer experience, US businesses are rolling out a multitude of pilot programs for autonomous deliveries of food and packages. In Houston, autonomous robots are delivering pizzas. In Ohio, a large grocery store chain is offering drone delivery. The company rolling out the delivery service expects to create 50 to 100 jobs for the partnership. These are just a couple of examples of the many pilot programs being tested to satisfy consumers’ demand for convenience. The investment in autonomous deliveries for perishable goods coincides with the national growth of e-commerce. As delivery methods evolve, available and underused retail and industrial space will have a greater opportunity to be repurposed.
E-commerce outpaces brick and mortar
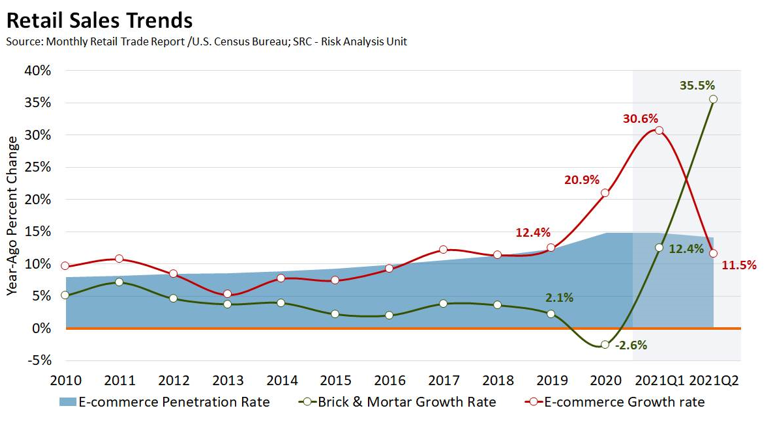
COVID-19 temporarily accelerated a boom in e-commerce as shelter-in-place mandates shifted consumer behavior. However, the shift to e-commerce is not new. During the recovery from the Great Recession in 2010, the growth rate for e-commerce sales was higher than that of traditional brick-and-mortar retailers. Starting in 2015, e-commerce sales grew at twice the rate of brick-and-mortar retailers. During the pandemic, lockdowns and concerns for safety accelerated e-commerce sales. With reopenings accelerating in 2021, the e-commerce growth rate has stabilized near the pre-pandemic pattern, and the brick-and-mortar growth rate scaled up sharply to recover from the decline in 2020, as the chart shows. The spread of the COVID-19 delta variant could create additional uncertainty for brick-and-mortar sales.
Banks also affected by technological advances
Technology is also bringing changes to banks. The future of brick-and-mortar banking is narrowing as more consumers conduct financial transactions on their mobile phones and other devices. Banks continue to invest more to improve their digital experience and view branch closures as an equitable cost-cutting measure. Between 2008 and 2020, 14 percent of branches closed in the United States. These branch closures, primarily driven by mergers, can hurt low-to-moderate income neighborhoods. For small and rural communities, a branch closure can disrupt relationships formed between the bank and its customers and deal a blow to the area economy by reducing jobs and leaving a commercial property vacant.
Labor challenges
Current labor conditions are creating another challenge for the retail industry. As the unemployment rate continues to trend toward prepandemic levels, some retailers have been forced to delay reopenings because of an inability to find workers. Some businesses are reporting that they must scale operations to align with the levels of employees who report to work. Currently, large cities such as Los Angeles, New York, and Chicago face higher unemployment, while markets such as Austin, Texas; San Jose, California; and Dallas/Fort Worth have relatively lower jobless rates. In the Sixth Federal Reserve District covered by the Atlanta Fed, second-quarter 2021 unemployment rates for Birmingham and Atlanta were below the national average, while New Orleans had an unemployment rate above the national average. Unemployment in New Orleans has been influenced by the spate of natural disasters that have battered that region.
Why do rates of recovery vary?
The COVID recovery will differ from the rebound that followed the 2009 financial crisis. The pandemic recession has challenged retailers like never before, producing a wide array of results. Some segments of retail are doing well, while others continue to face significant headwinds. Local market conditions play a factor. For example, in a market with declining population and a greater concentration of slower-growth industries, the revival of the physical retail market may be a slower process, and it may become necessary to find alternate uses for vacant retail space. However, areas with strong in-migration and a lower cost of living could benefit from growth that may accelerate the repurposing of vacant retail space.
Peyton Stanley, intern from the University of Florida, and Brian Bailey, a commercial real estate subject matter expert and senior policy adviser, both in the Atlanta Fed's Supervision, Regulation, and Credit Division