National affordability

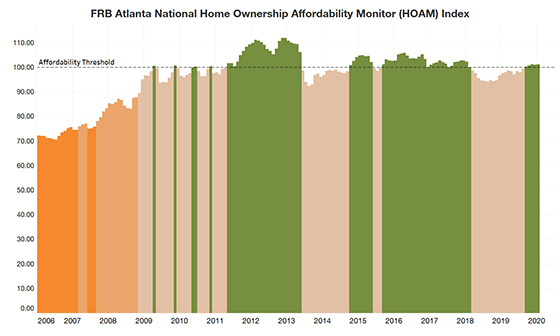
Prior to the COVID-19 crisis, home ownership was becoming more affordable in the United States as interest rates declined and household incomes improved, according to the Federal Reserve Bank of Atlanta’s Home Ownership Affordability Monitor (HOAM) index. Still, at the start of the new year and prior to the important spring selling season, the U.S. housing market was only marginally affordable for the median-income household. In January 2020, home ownership costs (as measured by principal and interest, taxes, and insurance) accounted for 29.6 percent of the annual median income of U.S. households, which was only slightly below the 30 percent affordability threshold set by HUD.
The 30-year fixed mortgage interest rate declined by 10 basis points in January from December 2019 and fell 84 basis points from January 2019. At the same time, the estimated national median household income rose by 2 percent in January to $63,166 from a year earlier and the national existing median home price rose by 6.9 percent to $268,044 in January 2020 from $250,667 in January 2019. Even as home prices rose, lower rates and higher incomes helped make houses more affordable. As a result, the HOAM index (which measures the ability of a median income household to absorb the estimated annual costs of owning a median-price home) rose by 3.8 percent over the past year, from 97.65 in January 2019 to 101.32 in January 2020. (Note: A HOAM index over 100 indicates that the median-priced home is affordable to the median-income household.)
Regional affordability

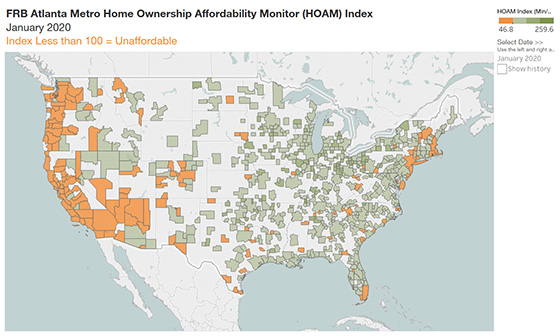
Home affordability varies significantly by metropolitan area. In January 2020, around 20 percent of metro areas had a HOAM index below 100, indicating that those regions were unaffordable to median-income households. High-cost metro areas on the West Coast and in the Northeast as well as South Florida were among the least affordable, while metros in the middle of the country, particularly in the Midwest, tended to be the most affordable.

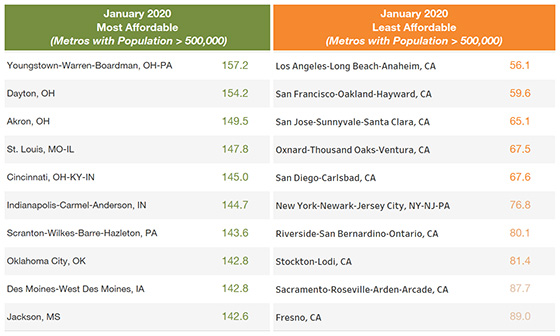
A look at the largest metro areas (those with populations greater than 500,000) indicated that Los Angeles-Long Beach-Anaheim, California, was the nation’s least affordable in January with a HOAM index of 56.1. The existing median home price there was $670,167, and the estimated median income was $76,933 a year. Those figures suggest the annual share of income needed to own the median-priced home was 53.6 percent, well above the 30 percent that is considered affordable. Although the San Francisco-Oakland-Hayward metro area was still the most expensive in the nation with a median home price of $988,889, its median income of $113,370 was higher than that of Los Angeles, and the total housing cost came to 53.4 percent of median income, slightly below Los Angeles. Though the median-income household in both metro areas may find home ownership difficult to attain, affordability in Los Angeles, San Francisco, and other high-cost metro areas has been improving as interest rates have decreased.
On the other end of the spectrum, the Youngstown metro area, which includes parts of Ohio and Pennsylvania, was the most affordable large metro in the nation this past January with a HOAM index of 157.2. With an existing median home price of $126,316 and median income of $48,740, the share of annual income needed to own the median-priced home was 19.1 percent, amply below the 30 percent affordability threshold. Despite rising home prices and flat income growth in Youngstown, affordability has increased by 3.8 percent over the past year mainly because of the declines in interest rates.
Among smaller metro areas (those with populations below 500,000), San Rafael, California, (located in the San Francisco Bay Area) was the least affordable with a HOAM index of 49.4. It had a median home price of $1.02 million and median household income of $113,370. Kokomo, Indiana, was the most affordable with a HOAM index of 207.4; it had a median home price of $130,646 and median household income of $57,540.
Metro areas that showed the greatest improvement in housing affordability over the past year tended to have flat or declining growth in home prices and stronger increases in incomes. For example, in Oakland, California, the median existing home price declined by 2.7 percent over the past year. At the same time, the estimated median household income rose by 3.3 percent. These changes, combined with the decline in mortgage interest rates, resulted in a 14.4 percent increase in the HOAM index in the area, up from 69.9 in January 2019 to 79.9 in January 2020.
COVID-19 impact
The COVID-19 pandemic is expected to have a significant impact on the housing market and home ownership affordability. Though they fluctuate week-to-week, 30-year fixed mortgage interest rates have declined overall since the coronavirus outbreak, down to 3.33 percent as of the beginning of April. This factor alone should have a positive effect on overall home ownership affordability. However, a full assessment of the impact of COVID-19 on home prices and household incomes, the other major components of home affordability, remains unclear. Still, housing demand is expected to be impaired by the health crisis and, as seen in previous down cycles, a major contraction in demand normally creates downward pressure on home prices. In addition, a rise in foreclosures could further increase downward price pressures on housing. Greater downward pressure on home prices combined with lower interest rates should increase home ownership affordability. However, down cycles could also stifle household incomes as unemployment rises, and lower income growth would hamper affordability. At this point, it is too early to tell which dynamics will have the strongest effect on home ownership affordability. As more data becomes available in the months to come, the magnitude of the impact of the pandemic will become known.
For more details, including metro level analysis, please visit the interactive Home Ownership Affordability Monitor tool.


