National affordability
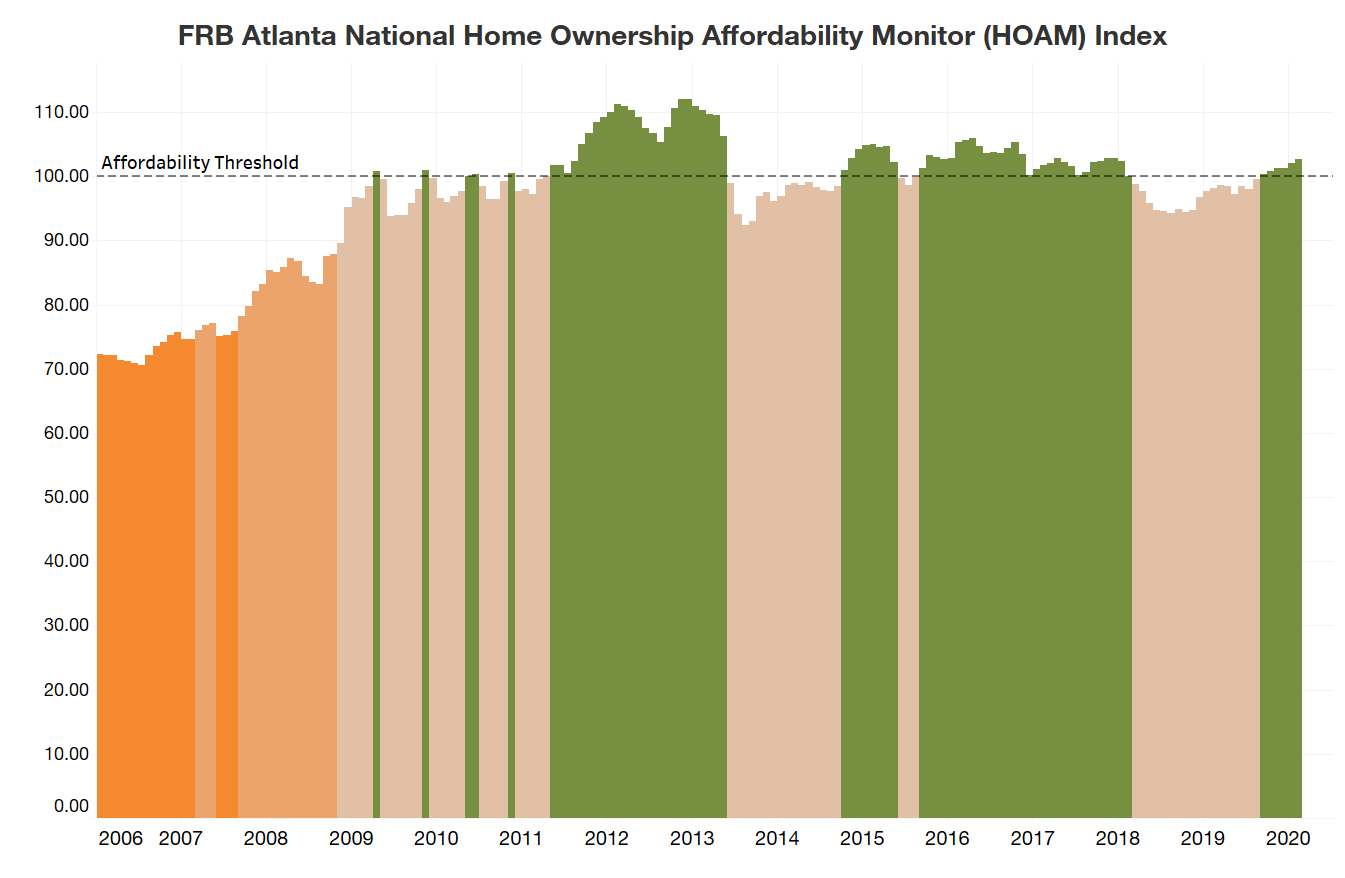
Home affordability improved in February prior to the spread of the COVID-19 pandemic in the United States, according to the Federal Reserve Bank of Atlanta’s Home Ownership Affordability Monitor (HOAM) index. In February, the HOAM index increased to 102.64 from 101.32 in January and was up 4.6 percent from February 2019. (Note: A HOAM index over 100 indicates that the median-priced home is affordable to the median-income household given the current interest rate.) Home ownership costs (as measured by principal and interest, taxes, and insurance) accounted for 29.2 percent of the annual median income of U.S. households, slightly below the 30 percent affordability threshold set by HUD.
The 30-year fixed mortgage interest rate ended the month at 3.5 percent, a drop of 10 basis points (bps) from January and a 90 bp decline from February 2019. The estimated national median household income in February was $63,230, flat compared with January but up by 2.5 percent from a year earlier. At $268,667, the February national median existing home price (three-month moving average) rose 1.1 percent from January and 7.5 percent from a year ago. Even as home prices continued to rise, lower rates and higher incomes helped bolster affordability in the nation overall.
Regional affordability
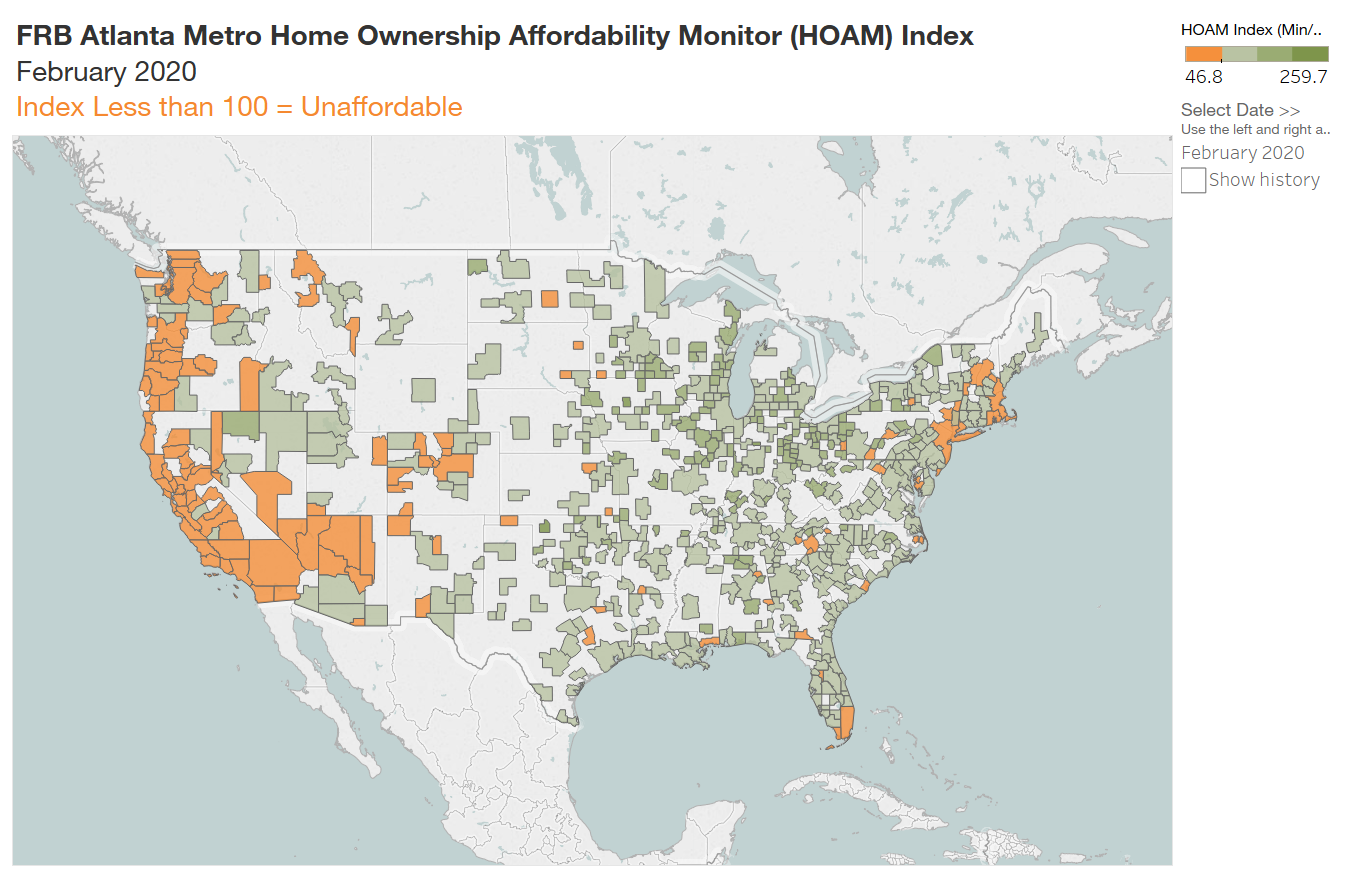
Home affordability varies significantly by metropolitan area. In February 2020, around 24 percent of metro areas had a HOAM index below 100, indicating that those metro areas were unaffordable to median-income households living within the particular area. In general, high-cost metro areas on the West Coast and in the Northeast as well as south Florida were among the least affordable, while metros in the middle of the country, particularly in the Midwest, tended to be the most affordable.
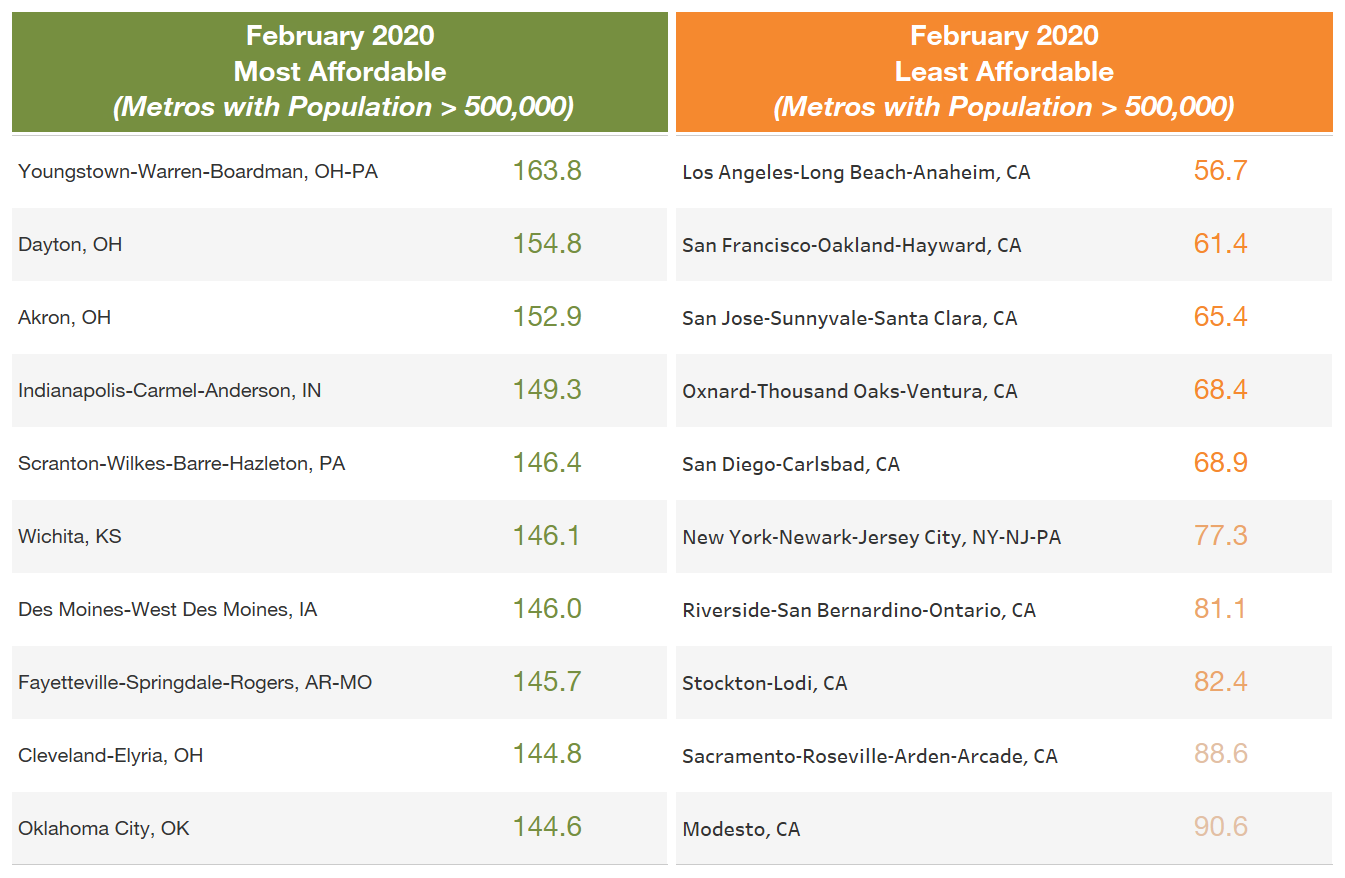
Among the largest metro areas (those with populations greater than 500,000), San Jose-Sunnyvale-Santa Clara, California, was the most expensive region in the nation with a median home price of $998,333. However, Los Angeles-Long Beach-Anaheim remained the nation’s least affordable large metro in February with a HOAM index of 56.7. Even though houses in San Jose are more expensive, home ownership affordability is slightly greater because household incomes there are generally higher than in Los Angeles ($130,973 for San Jose compared with $76,885 in Los Angeles). With a median existing home price of $674,250 in Los Angeles, the annual share of income needed to own a home in the area was 53.1 percent, the highest home ownership cost of any other large metro and well above the 30 percent that is considered affordable. However, higher costs continue to be somewhat offset by declining interest rates, which led to a modest improvement in overall home ownership affordability in Los Angeles compared with last month, when the area’s HOAM index was 56.2.
On the other end of the spectrum, the Youngstown, Ohio, metro area, which includes parts of Ohio and Pennsylvania, was the most affordable large metro in the nation in February with a HOAM index of 163.8. The Youngstown metro area was also the least expensive among large metro areas in the nation with an existing median home price of $121,800. With median income of $48,818, the annual home ownership cost for a median-income household was 18.3 percent, amply below the 30 percent affordability threshold. Despite rising home prices and flat income growth in Youngstown, affordability increased 6.8 percent over the past year mainly because of declining interest rates.
Among smaller metro areas (those with populations below 500,000), San Rafael, California, (located in the San Francisco Bay region) remained the least affordable during the first two months of the year with a HOAM index of 56.2. In February, it had a median home price of $1.01 million (the highest in the nation) and a median household income of $113,389 annually. Kokomo, Indiana, remained the most affordable smaller metro with a HOAM index of 214.7—it had a median home price of $123,539 and median household income of $57,531. Although Danville, Illinois, was in fact the least expensive market with a median existing home price of $80,500, Kokomo was still more affordable because incomes there were higher ($57,531 compared to $43,730 for Danville).
Metro areas that showed the greatest improvement in housing affordability over the past year tended to have flat or declining growth in home prices and stronger increases in incomes. For example, Scottsbluff, Nebraska, had the sharpest rise in home ownership affordability from the year earlier with a 23 percent increase in its HOAM index. Although earnings remained flat, the median existing home price in the region ($118,167 in February 2020) declined by 17.8 percent in the past year, boosting affordability for the median-income household.
COVID-19 impact
The impact of the COVID-19 pandemic is expected to be reflected more in the analysis of home ownership affordability as data on home prices and incomes for March and April of this year become available. Though 30-year fixed interest rates continue to fluctuate from week to week, so far they have remained near historic lows since the pandemic began. This factor should have a positive effect on overall home ownership affordability. However, a full assessment of the impact of COVID-19 on home prices and household incomes remains unclear. With unemployment on the rise, consumer purchasing power is expected to be significantly strained. Meanwhile, home prices have so far remained resilient during the pandemic, with no significant declines, as existing home inventory has dropped and sellers remain hesitant to lower asking prices. Although this situation may change as the crisis continues, a strain on household incomes coupled with little-to-no downward pressure on home prices will likely hurt home ownership affordability. In addition, tighter lending standards (higher down payment and credit score requirements) that have been implemented since the beginning of the crisis will make it difficult for some potential buyers to qualify for a mortgage. This is especially true for lower- to more moderate-income households. Furthermore, mortgage loan forbearances have increased significantly since March and currently represent around 7.9 percent of all mortgages, according to data provided by Black Knight Inc. Should the current crisis lead to a rise in mortgage defaults and foreclosures, there would be significant implications for home prices and affordability.
For more details, including metro level analysis, please visit the interactive Home Ownership Affordability Monitor tool.


