National affordability
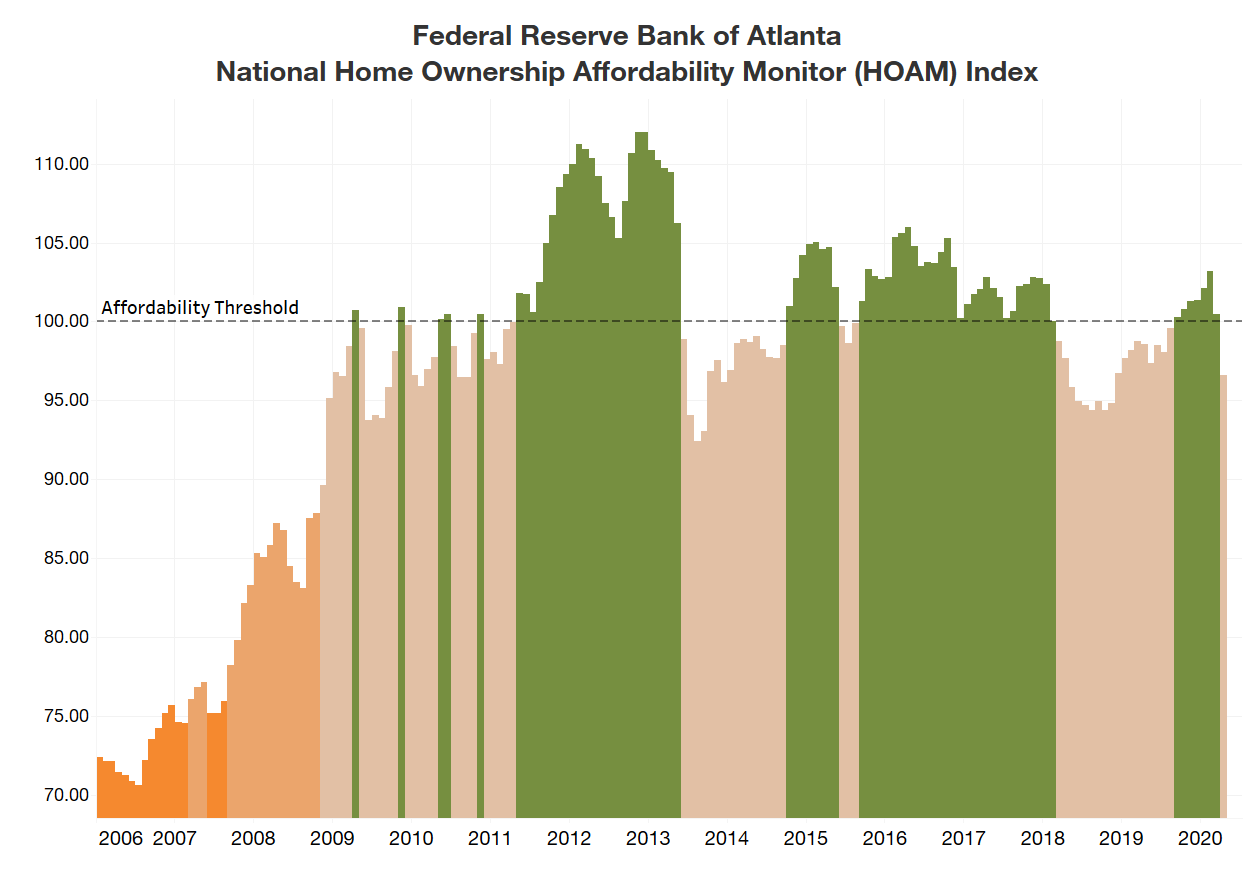
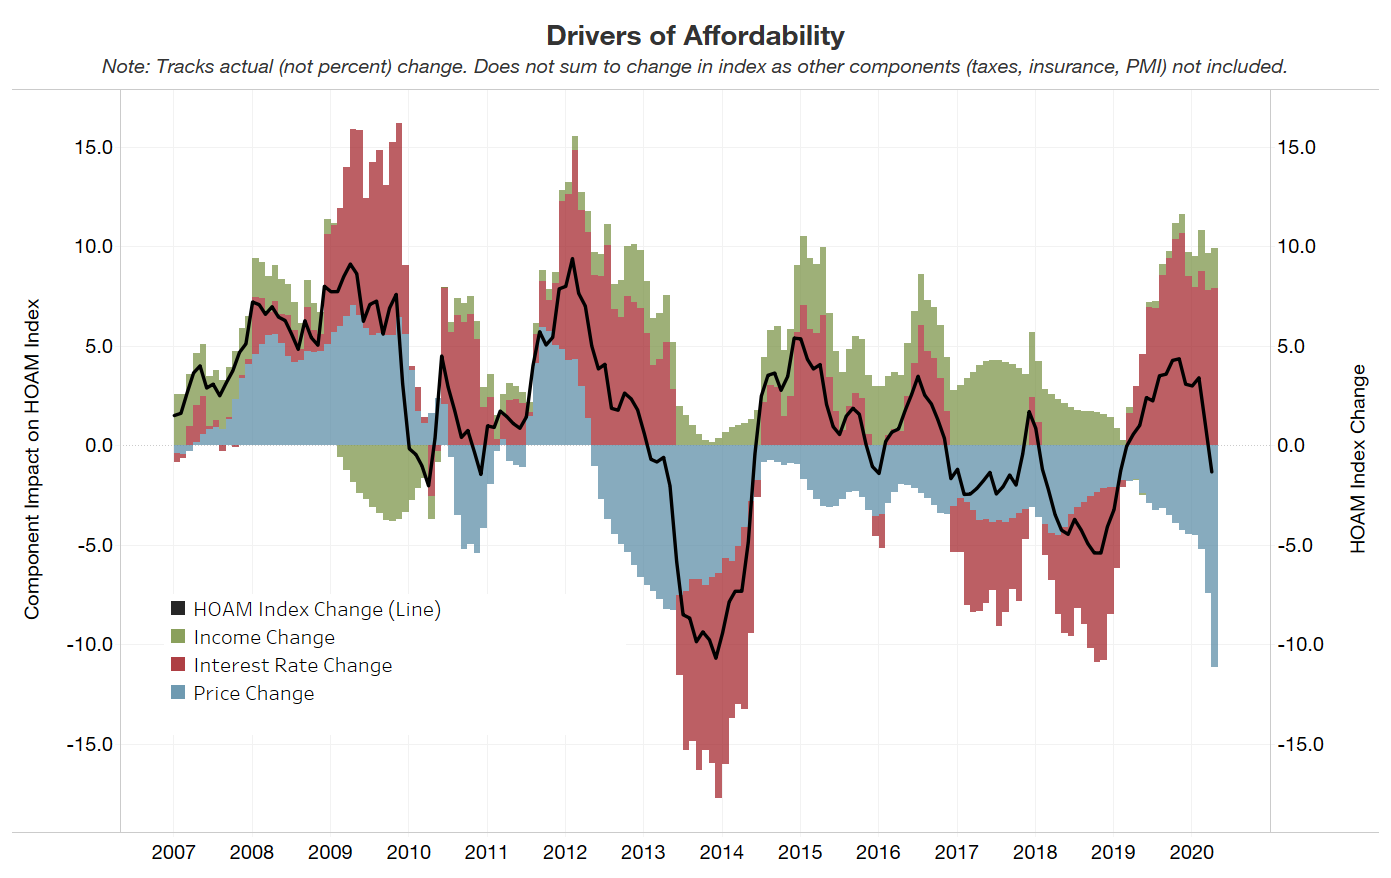
Home ownership affordability declined in April as the median existing home sales price in the United States reached a record high, according to the Federal Reserve Bank of Atlanta’s Home Ownership Affordability Monitor (HOAM) index. In April, the HOAM index declined to 96.61 from 100.46 in March and 98.55 from April 2019. (Note: A HOAM index below 100 indicates that the median-priced home is unaffordable to the median-income household given the current interest rate.) Home ownership costs (as measured by principal and interest, taxes, and insurance) accounted for 31.1 percent of the annual median income of U.S. households, above the 30 percent affordability threshold set by HUD. April was the first time since August of last year that the national HOAM index dropped below the affordability threshold.
The 30-year fixed mortgage interest rate ended the month at 3.3 percent, a drop of 14 basis points (bp) from March and an 84 bp decline from April 2019. The estimated national median household income in April was $63,356, up 2.7 percent from a year earlier. At $295,000, the April national median existing home price (three-month moving average) rose by 6.6 percent from March and was up a sharp 15.6 percent from a year ago. April marked the highest national median existing home price on record, and higher home prices are the biggest contributor to declines in affordability. Since the beginning of the COVID-19 pandemic, U.S. market inventory has contracted significantly, creating substantial upward pressure on home prices. Although interest rates remained very low, the sharp increase in the median home price strained home ownership affordability nationally.
Regional affordability
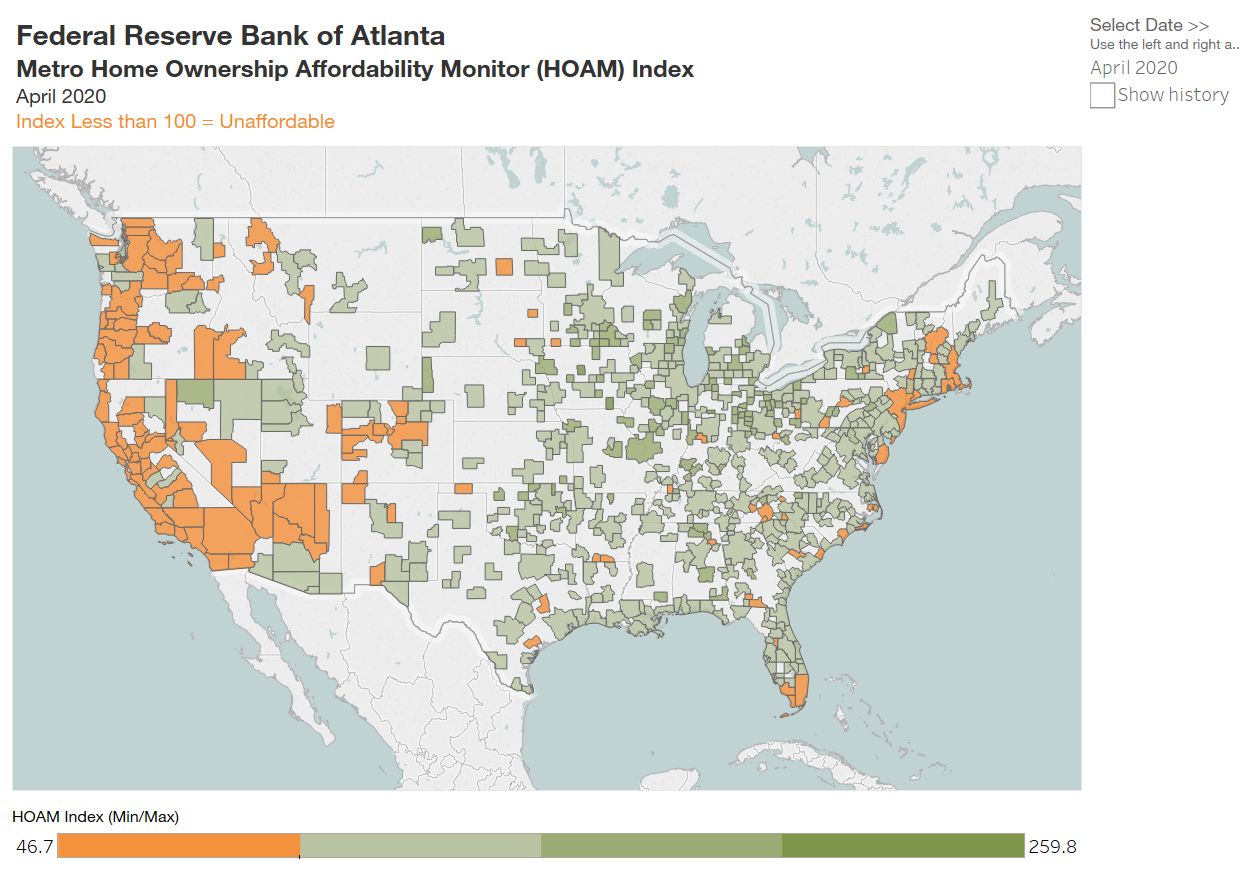
Although national home ownership affordability declined in April, lower interest rates helped improve affordability in many U.S. regions. Around 20 percent of metro areas included in the HOAM had an index below 100 in April, indicating that they were unaffordable to median-income households living within the particular area. On the other hand, a clear majority of metro areas—80 percent—had an index above 100 and were considered affordable. In general, high-cost metro areas on the West Coast and in the Northeast as well as South Florida were among the least affordable, while metros in the middle of the country, particularly in the Midwest, tended to be the most affordable.
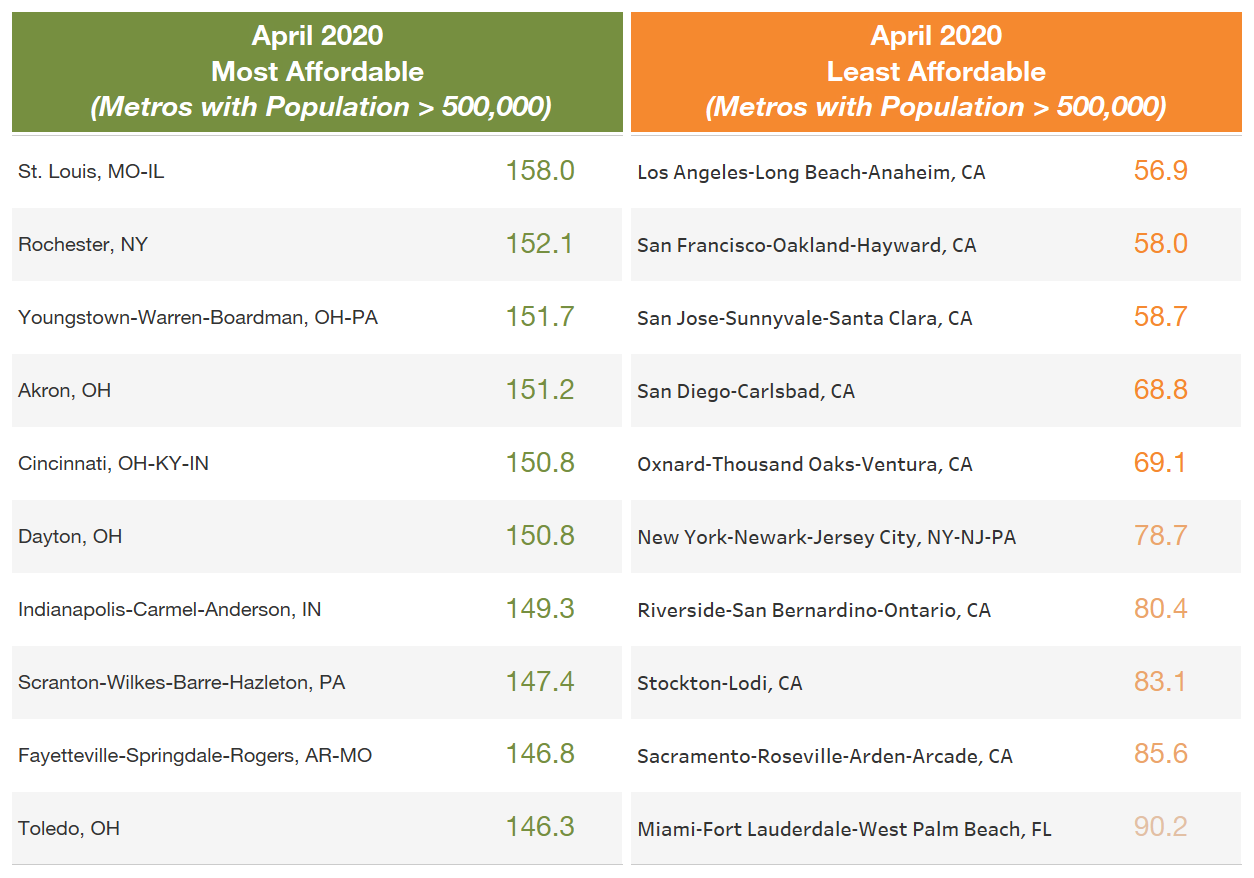
Among the nation’s largest metro areas (those with populations greater than 500,000), San Jose-Sunnyvale-Santa Clara, California, was the most expensive in April with a median existing home price of $1.1 million. Median prices rose by 9.6 percent over the past year in the region. Meanwhile, Los Angeles-Long Beach-Anaheim remained the nation’s least affordable large metro in April with a HOAM index of 56.9. Even though homes in San Jose were more expensive, household incomes there were generally higher than in Los Angeles ($130,955 for San Jose compared with $76,948 in Los Angeles), making San Jose slightly more affordable for home owners there.
With a median existing home price of $683,583, the annual share of income needed to own a home in Los Angeles was 53 percent, the highest home ownership cost among large metros and well above the 30 percent that is considered affordable. Still, rising home prices continue to be somewhat offset by declining interest rates, which led to a modest improvement in overall home ownership affordability in Los Angeles compared with the previous month.
The least expensive large metro area in April was Rochester, New York, where the median sales price was $129,983. Home prices in Rochester dropped 9.7 percent over the past year. In terms of home ownership affordability, the St. Louis, Missouri-Illinois area was the most affordable large metro in the nation in April with a HOAM index of 158. Its estimated median household income in April was $65,519, and the median existing home sales price was $170,883. The median income household in the area would spend 19 percent of its income for housing annually, which is the lowest home ownership cost among all large metros and amply below the 30 percent affordability threshold. Similar to Rochester, home prices in St. Louis fell 9.4 percent over the year that ended in April. The decline in home prices, coupled with lower interest rates, combined to increase home ownership affordability in the region.
With a median existing home price of $788,000 and a HOAM index of 57.3, Santa Cruz-Watsonville, California, was both the most expensive and least affordable small metro area in the United States (defined as metro areas with populations below 500,000) in April. The least expensive small metro in April was Ottumwa, Iowa, where the median existing home price came to $64,750. Kokomo, Indiana, remained the most affordable small metro with a HOAM index of 228.5. It had a median home price of $116,677 and median household income of $57,602. The median existing home price in the region declined sharply year over year, by 11.5 percent.
Metro areas that showed the greatest improvement in homeownership affordability over the past year tended to have flat or declining growth in home prices and/or stronger increases in incomes. Both St. Louis and Rochester, the most affordable and least expensive large markets in April, respectively, top the list in terms of greatest improvement in affordability. In St. Louis, affordability increased by 16.5 percent, and Rochester had a 13.1 percent gain. However, the improvement in affordability in both areas was primarily attributed to sharp declines in home prices. Meanwhile, Charleston, South Carolina, had the sharpest falloff in home ownership affordability from April 2019 to April 2020, down by 8.4 percent. Bucking the trend in St. Louis and Rochester, home prices in Charleston increased sharply over the past year, rising 21.1 percent. As of April, the median home price in Charleston reached a record high of $306,188, up from $253,883 a year ago.
COVID-19’s impact
As the nation and the economy continue to wrestle with the effects of the COVID-19 pandemic, the housing market has remained surprisingly resilient. Although demand for housing contracted as many states instituted mandatory stay-at-home orders, supply contracted as well, as many would-be sellers decided not to sell. As a result, home prices have remained stable in most markets and increased nationally. Now that states are beginning to open back up after shutdowns, pent-up demand for housing is accelerating, bringing more upward pressure to home prices. Should this trend continue, it will create a drag on home ownership affordability. In addition, with unemployment remaining high, consumer purchasing power is expected to be significantly strained, a factor that would further weigh on affordability. Still, historically low interest rates may continue to boost demand and keep housing affordable for many households as the nation emerges from the pandemic. Finally, it should be noted that mortgage-loan forbearances have increased significantly since March and currently represent around 9 percent of all mortgages, according to data provided by Black Knight Inc. Should the current crisis lead to a rise in mortgage defaults and foreclosures, there would be significant implications for home prices and affordability.
For more details, including metro level analysis, please visit the interactive Home Ownership Affordability Monitor tool.


