
- Home prices jump 14 percent from a year earlier
- Midwest metros are among the most affordable
- Milwaukee, New York, and Cape Coral post largest declines in affordability
Although a regional look shows some metro areas are benefiting from historically low interest rates, a key measure of housing affordability from the Federal Reserve Bank of Atlanta shows a growing share of households can no longer afford to own a home as prices continue to climb nationwide.
National affordability
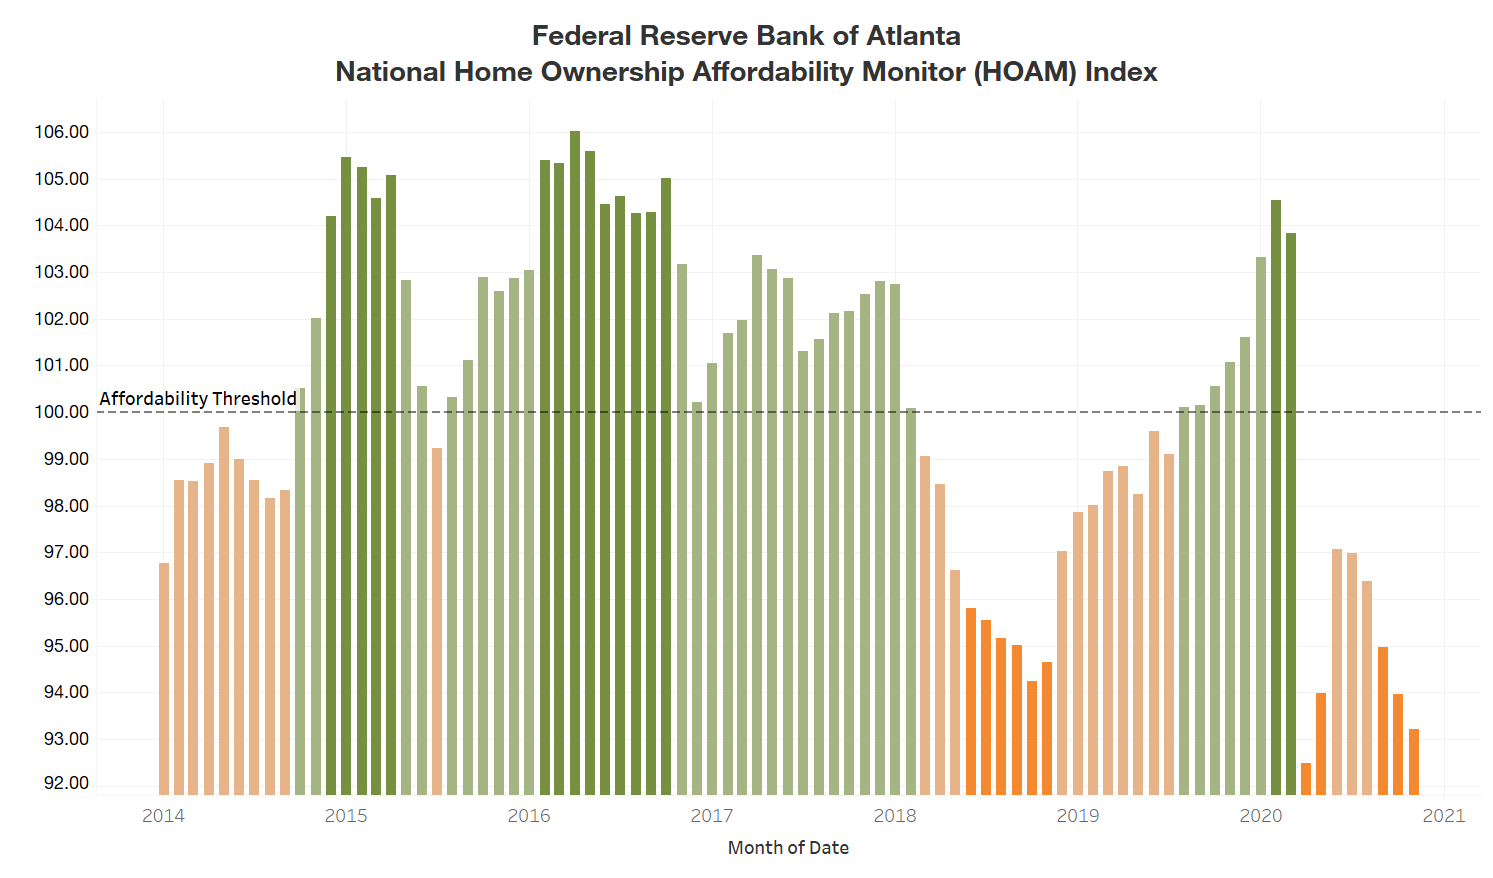
The Atlanta Fed’s Home Ownership Affordability Monitor (HOAM) index indicates that home ownership affordability continued to contract in the United States overall during November. Although historically low interest rates are driving demand for housing, the number of homes for sale remains limited. As a result, prices continue to rise, making it harder for the average income household to afford a home.
A HOAM index below 100 indicates that the median-priced home is unaffordable to the median-income household given the current interest rate. In November, the HOAM index was virtually flat, edging down to 93.21 from a revised 93.96 for October. However, November marked the eighth straight month in which the HOAM index was below 100. The November HOAM index was also below its 101.08 reading a year earlier. Home ownership costs in the month (as measured by principal and interest, taxes, and insurance) accounted for 32.2 percent of the annual median income of U.S. households, which is above the 30 percent affordability threshold set by the U.S. Department of Housing and Urban Development.
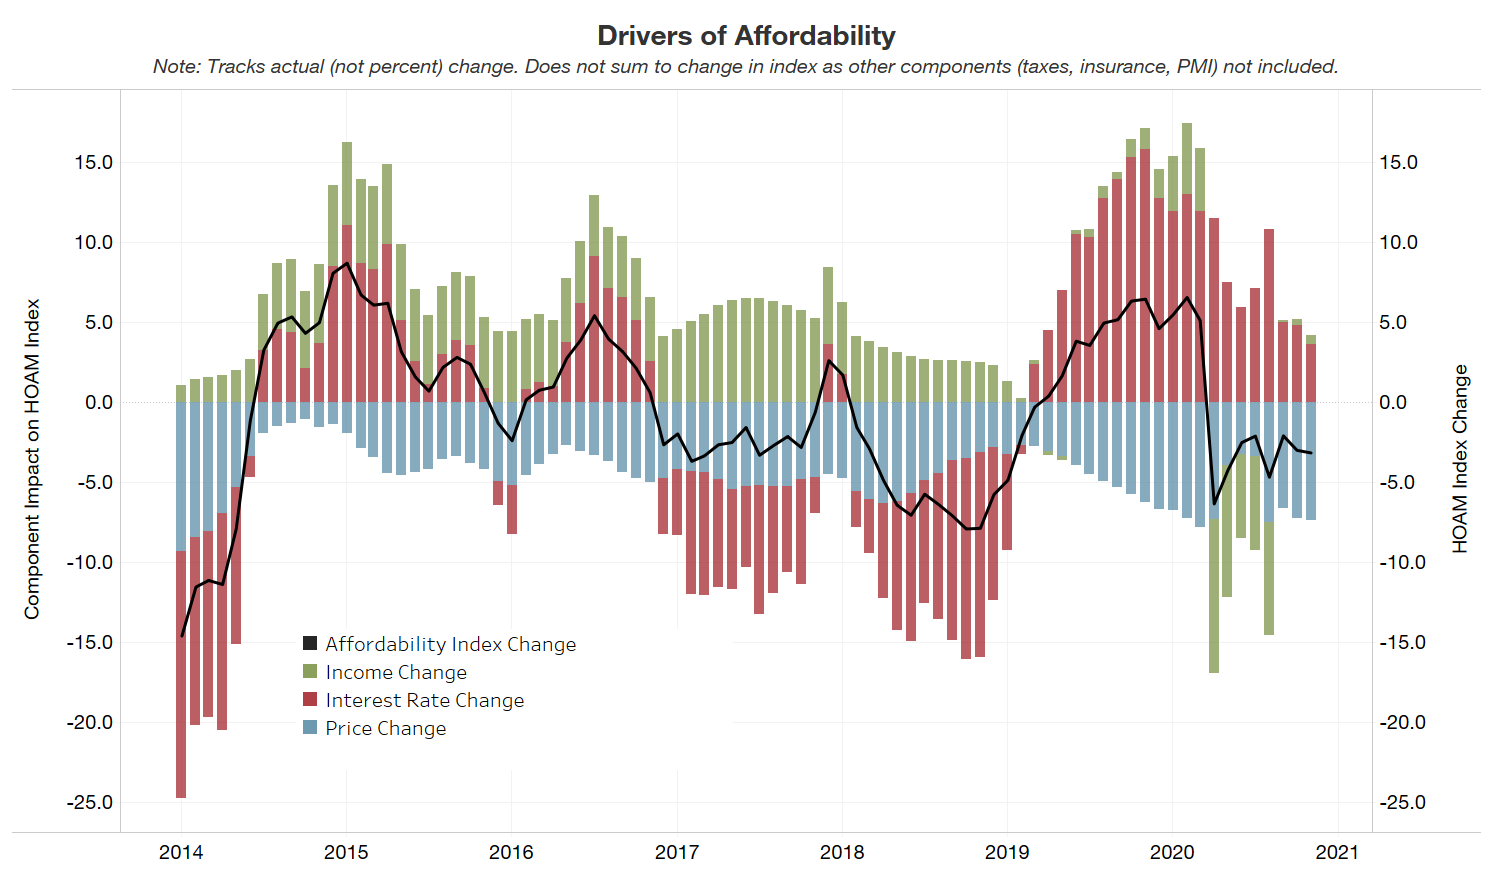
Affordability continued to decline despite low interest rates. The 30-year fixed mortgage rate ended November at 2.8 percent, which was on par with October but a 90 basis point decline from November 2019. However, the strain on household incomes and the steady rise in home prices have more than offset any positive effects on affordability from lower rates. With the COVID-19 pandemic still weighing on the economy, the estimated median household income in the United States in November ($59,667) was down 5.4 percent from a year earlier. Meanwhile, the national median existing home price (three-month moving average) rose to $303,750 in November, up 1.9 percent from a revised $298,000 for October. Compared with a year ago, home prices rose 14.1 percent.
Regional affordability
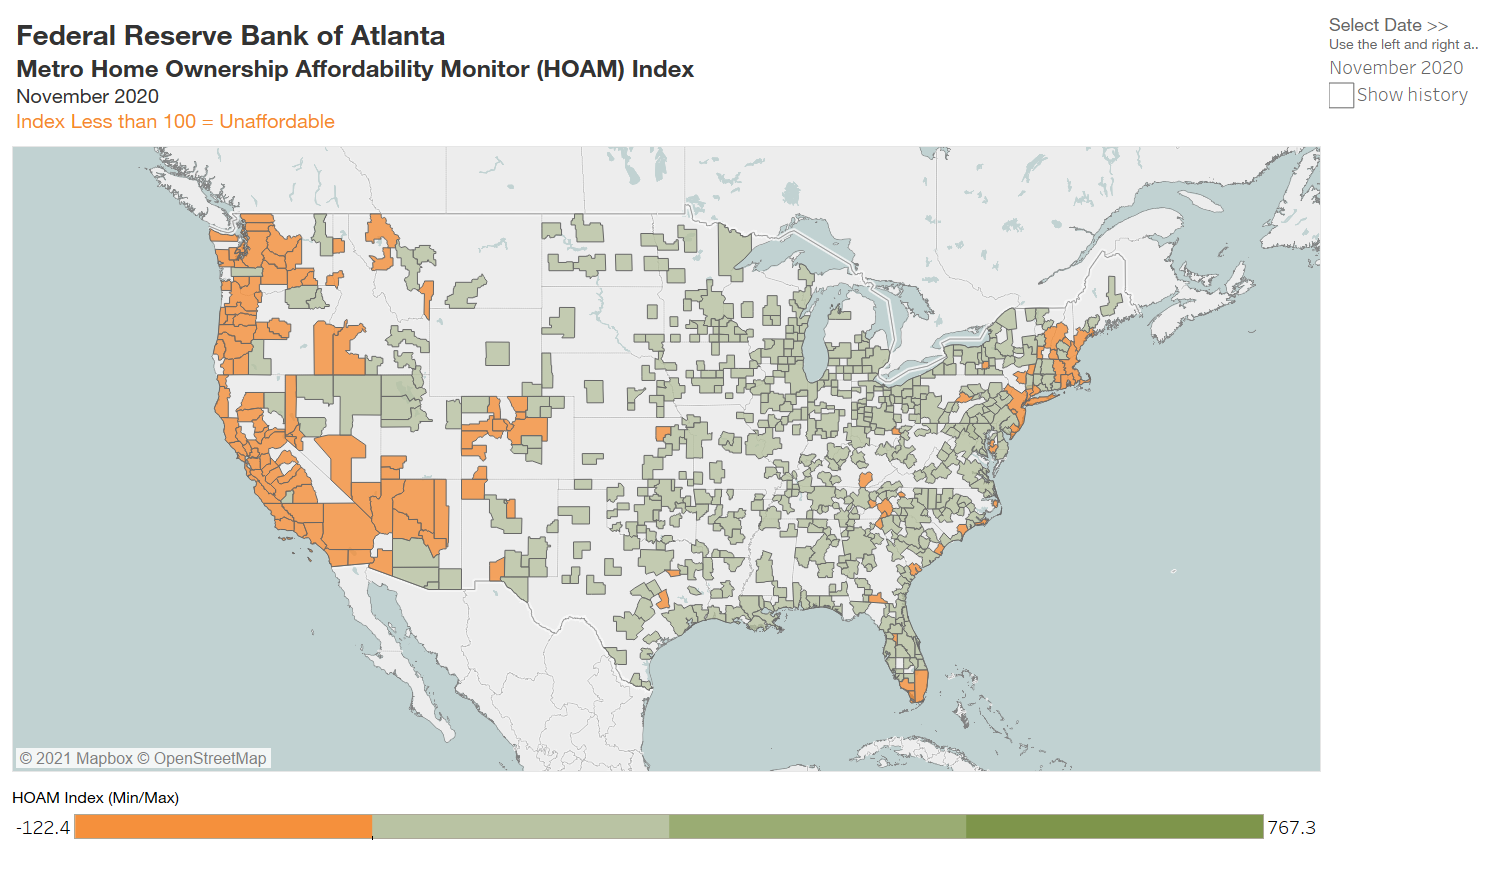
Just over 22 percent of metro areas in the United States had a HOAM index below 100 in November, indicating that they were unaffordable to median-income households in the area. By contrast, 78 percent had an index above 100 and were considered affordable. Even so, 42 percent of metro areas saw a decline in affordability from a year earlier as higher home prices and a continued strain on household incomes took their toll. In general, high-cost metro areas on the West Coast as well as in the Northeast and south Florida were among the least affordable. Metros in the middle of the country, particularly in the Midwest, tended to be the most affordable.
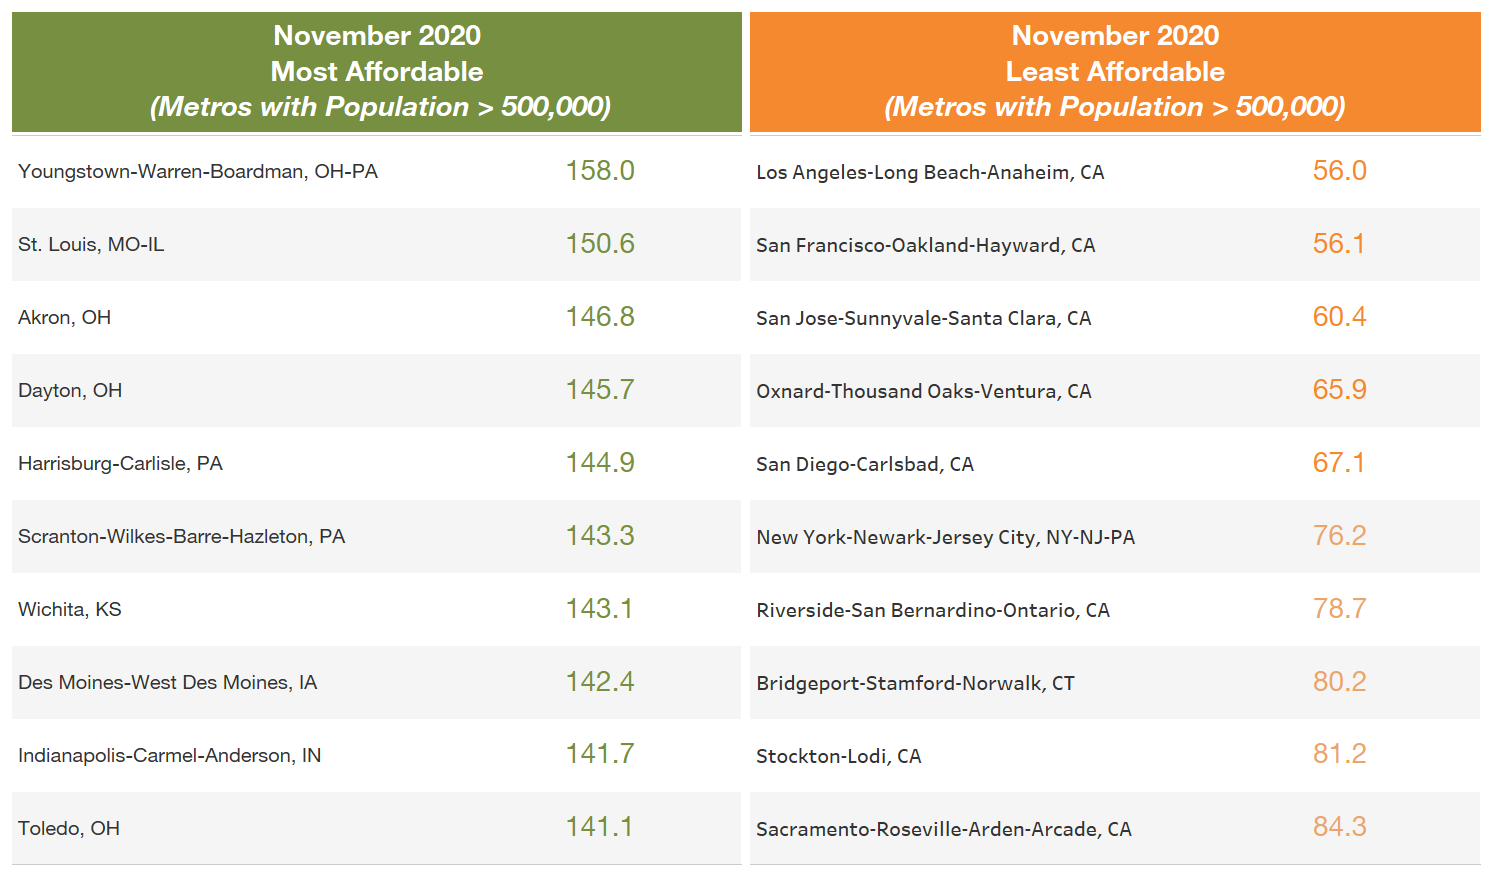
Among the nation’s largest metro areas (those with populations greater than 500,000), San Jose-Sunnyvale-Santa Clara, California, was the most expensive in November with a median home price of $1.18 million. The median price in San Jose rose 16.6 percent from November 2019 primarily because of high demand and limited inventory. Meanwhile, the Los Angeles-Long Beach-Anaheim, California, area was the nation’s least affordable large metro in November with a HOAM index of 56.
Even though homes in San Jose were much more expensive compared with those in Los Angeles (where the median price was $741,375), affordability in San Jose is greater because incomes there were higher ($131,148 for San Jose compared with $77,215 for Los Angeles). San Jose’s higher income levels bring its annual cost of homeownership to 49.7 percent of the median household income; for Los Angeles, that figure is 53.7 percent, the highest among large U.S. metros.
The least expensive large metro area in November remained Youngstown-Warren-Boardman, Ohio, despite average home prices rising 2.3 percent over the past year to $139,663. Youngstown also remained the most affordable large metro in the nation in November with a HOAM index of 158. The area’s estimated median household income in November was $49,083, and, on average, the share of income needed to afford the median-priced home in Youngstown was 19 percent, the lowest among large metros.
With a median home price of $909,250, median household income of $89,746, and a HOAM index of 53.4, Santa Cruz-Watsonville, California, was both the most expensive and least affordable small metro in the United States (metros with populations below 500,000) in November. On average, the cost to own the median-priced home in Santa Cruz was 56 percent of the median household income. Meanwhile, the least expensive small metro was Danville, Illinois, where the median home price came to $96,850 in November. Kokomo, Indiana, remained the most affordable small metro with a HOAM index of 192.05; it had a median home value of $153,380 and median household income of $57,648. The cost to own the median-priced home would amount to 15.6 percent of median incomes in the area.
Changes in affordability
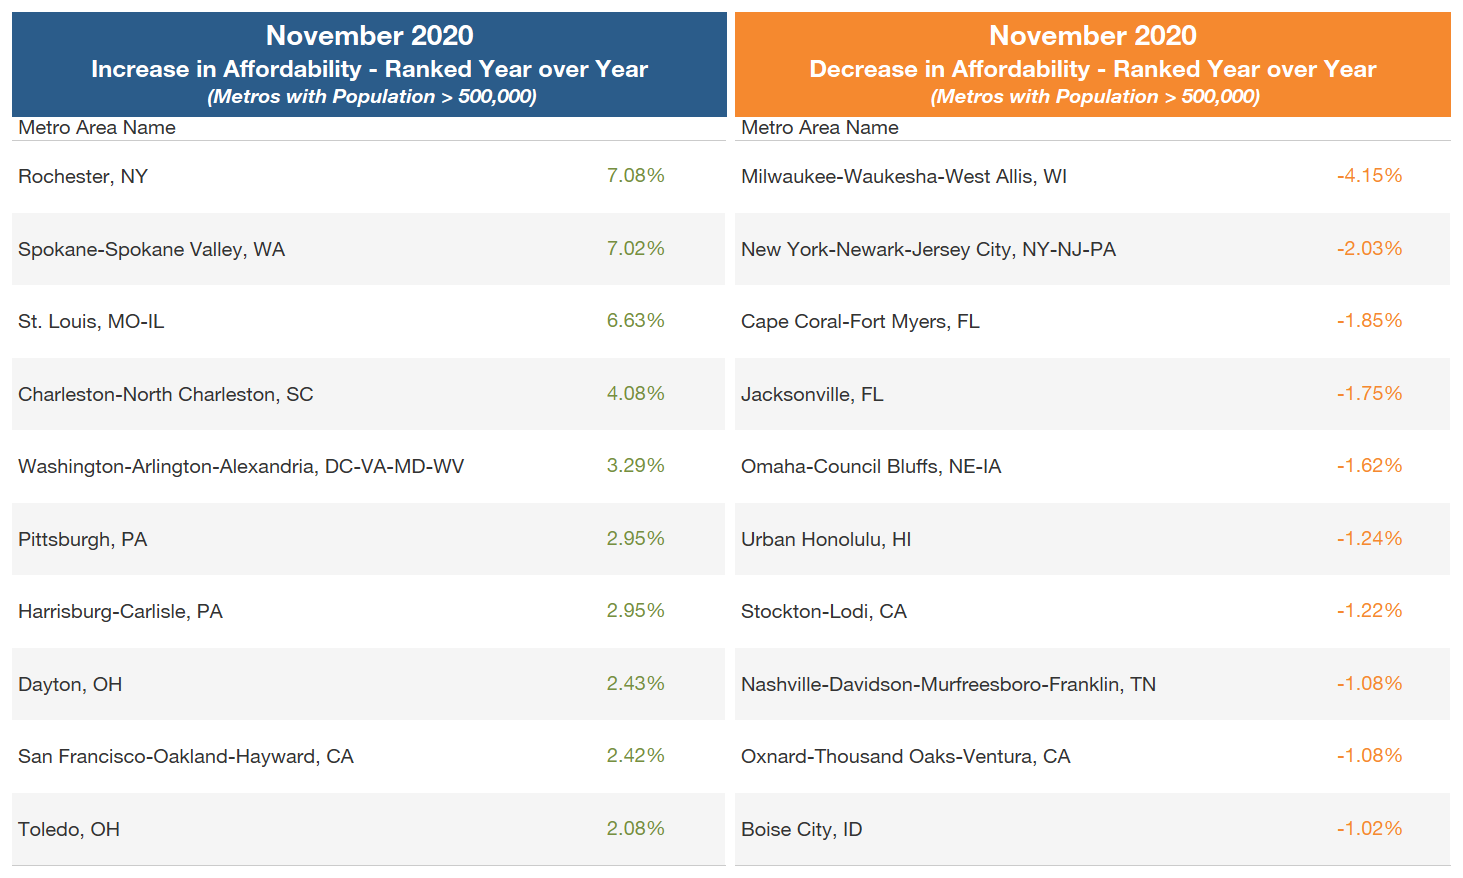
Despite the national decline, affordability in several cities increased because of falling home prices and lower interest rates. Among metro areas with populations above 500,000, Rochester, New York; Washington’s Spokane-Spokane Valley; and St. Louis, Missouri, recorded the greatest improvement in affordability over the past year, with increases of 7.08 percent, 7.02 percent, and 6.63 percent, respectively. Sharp declines in home prices and declining interest rates in those metros helped boost affordability. In addition, some higher-cost markets such as Washington, DC and San Francisco (see table above), were among large metros that became more affordable mainly because of decreasing interest rates and stable household incomes.
Meanwhile, Milwaukee, Wisconsin; the New York metro area; and Cape Coral, Florida, were the three metro areas with the biggest drop in affordability over the past year, with declines of 4.15 percent, 2.03 percent, and 1.85 percent, respectively. These regions became less affordable because an acceleration in home price growth offset positive effects from lower interest rates. The median home price in Milwaukee climbed by 19.9 percent over the past year, while prices in New York and Cape Coral rose 11.9 percent and 15.9 percent, respectively. New York had the greatest home price acceleration in recent months.
Housing market update
Although weakness persists in many other sectors in the COVID-19 economic slowdown, the housing market has remained a bright spot. Home sales picked up speed over the past year as relatively low interest rates fueled demand. Existing home sales rose 22.2 percent in December from the year earlier, eclipsing any losses in activity at the onset of the pandemic, according to the National Association of Realtors. Still, the prevailing challenge facing the housing market continues to be a shortage of supply. According to NAR, inventory dropped by 23 percent in December, and the supply stood at a historic low of 1.9 months. This level is well below the four-to-six months’ supply that is typically considered balanced, signaling the current market has a significant supply shortage. This imbalance is likely to affect the market during the next year, placing upward pressure on prices and a continued strain on affordability.
Lower home supply continued to drive demand for new construction, leading to optimism and expectations for growth in 2021 in the homebuilding industry. Though low interest rates have helped offset rising prices for some buyers, many builders caution that strong demand may stretch capacity within the sector, pushing up costs. And, with inventory levels tight, new home prices are expected to keep climbing, creating a growing hurdle for would-be homebuyers.
Finally, after steadily falling for several months, the number of mortgage loans in forbearance fluctuated at the end of 2020 as the pandemic worsened. As of the middle of January, the share of mortgages in forbearance stood at 5.2 percent, according to data provided by Black Knight. Delinquencies remain elevated, particularly in regions that have significant exposure to hard-hit sectors such as transportation and leisure and hospitality. FHA and VA mortgages tend to have higher delinquency rates compared with conventional mortgages, and, according to Black Knight, a higher share of these loans remain in forbearance: 9.4 percent. As forbearance programs are expected to expire in the months ahead, high levels of mortgage debt that will still be delinquent nationally could raise the possibility of increased defaults, which would have a significant impact on the housing market.
For more details, including metro level analysis, please visit the interactive Home Ownership Affordability Monitor.


