

Key points
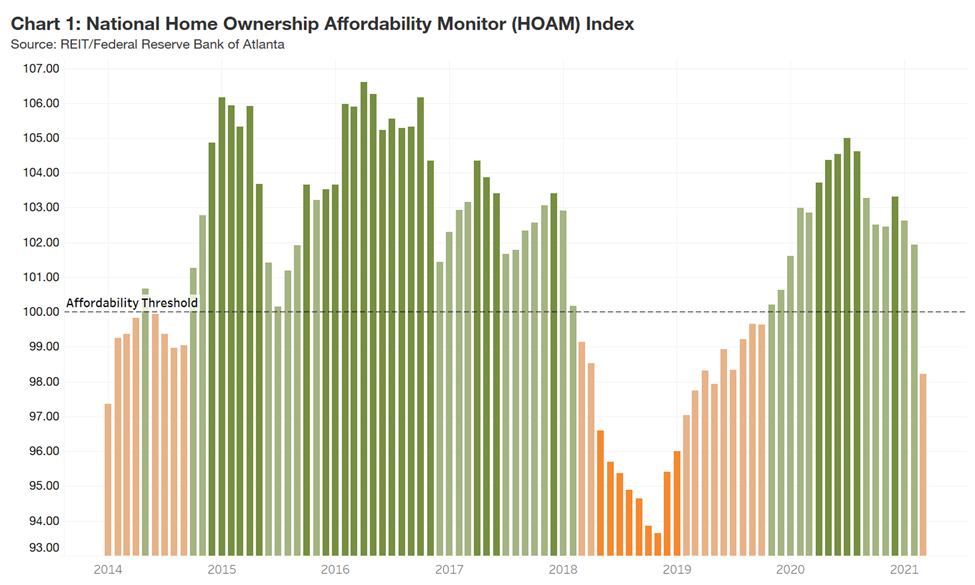
- For the first time since October 2019, the Atlanta Fed’s Home Ownership Affordability Monitor (HOAM) Index dropped below 100, indicating that median-income households can no longer afford median-priced homes at current interest rates.
- Price growth in March 2021 reached the highest level since December 2005.
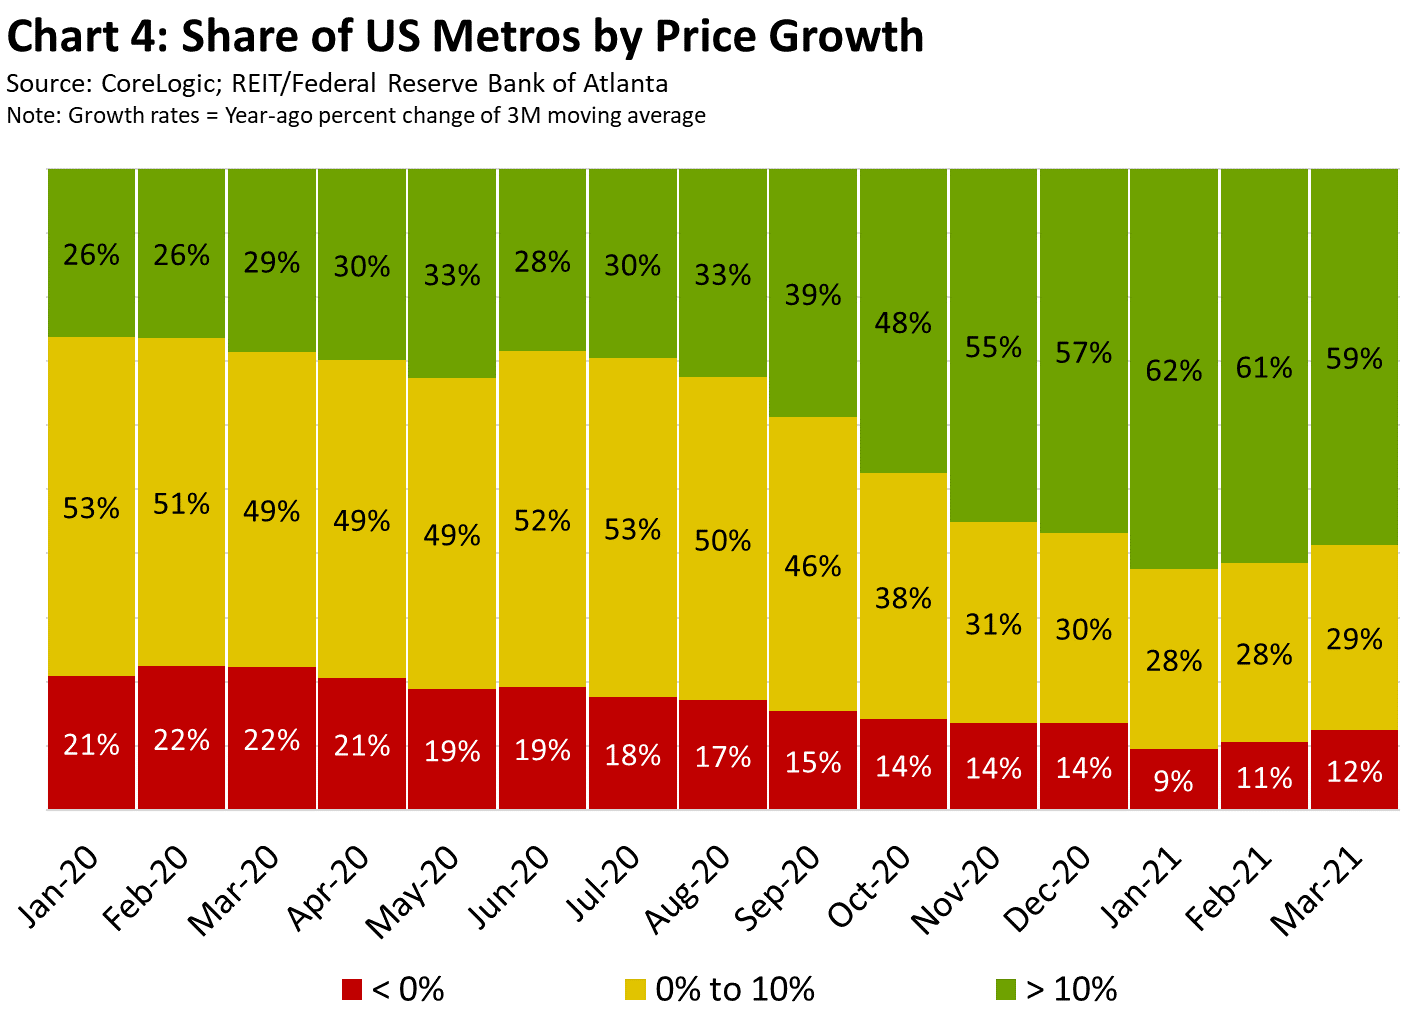
- Just under 60 percent of metros saw double-digit percentage price increases year-over-year in March 2021.
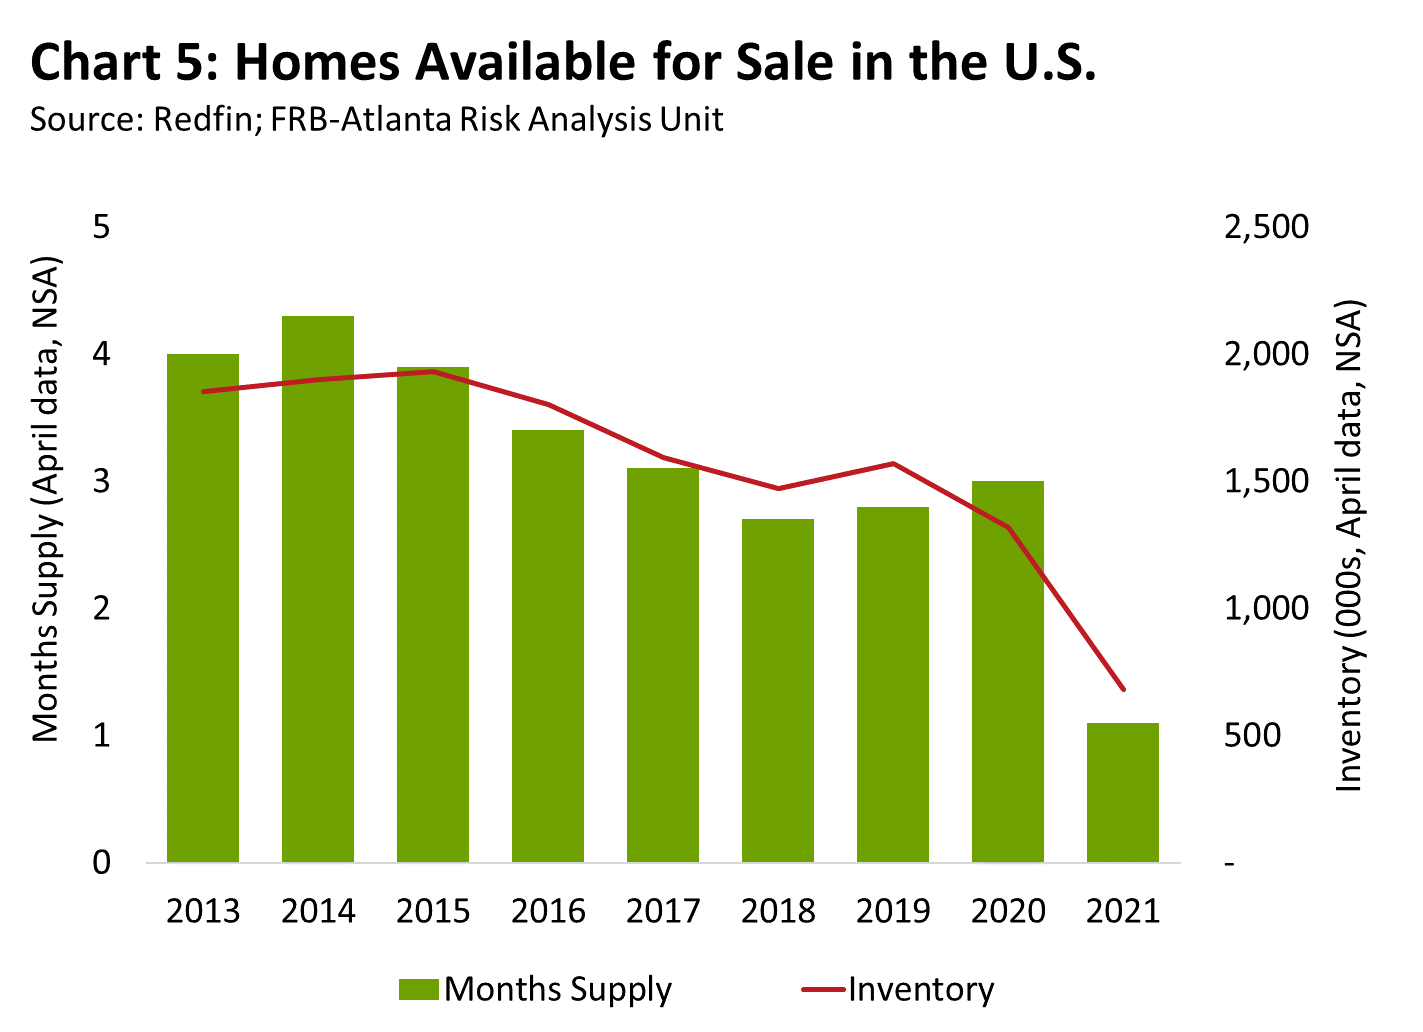
- Existing home inventory continues to fall, and many markets have significant supply shortages.
- Recent surveys of consumer sentiment indicate growing concern over inflation, which could dampen plans for expenditures, possibly altering plans to purchase homes in the near term.
National affordability
Continued robust home price appreciation, the economic challenges of the lockdown, and increases in mortgage rates have eroded home affordability nationally. Heading into 2020, affordability was increasing—even in the face of rising home prices—as buyers benefitted from historically low interest rates and steady income growth. Lockdowns stalled sales in April and May 2020, but sales roared back as economies began to reopen. The national Home Ownership Affordability Monitor (HOAM) index reached its highest point in the pandemic period last July. In August, however, affordability began to retreat as rising home prices overtook the positive effects of low rates and income growth. The national HOAM index fell from 101.94 in February 2021 to 98.22 in March 2021, indicating homes were no longer affordable for the median-income household (see chart 1). Mortgage rates decreased from late March through April but climbed back to 3.0 percent as of late May. If prices and interest rates continue to rise, affordability is expected to keep declining, and median-income households will find it more and more difficult to purchase a home.
Regional affordability
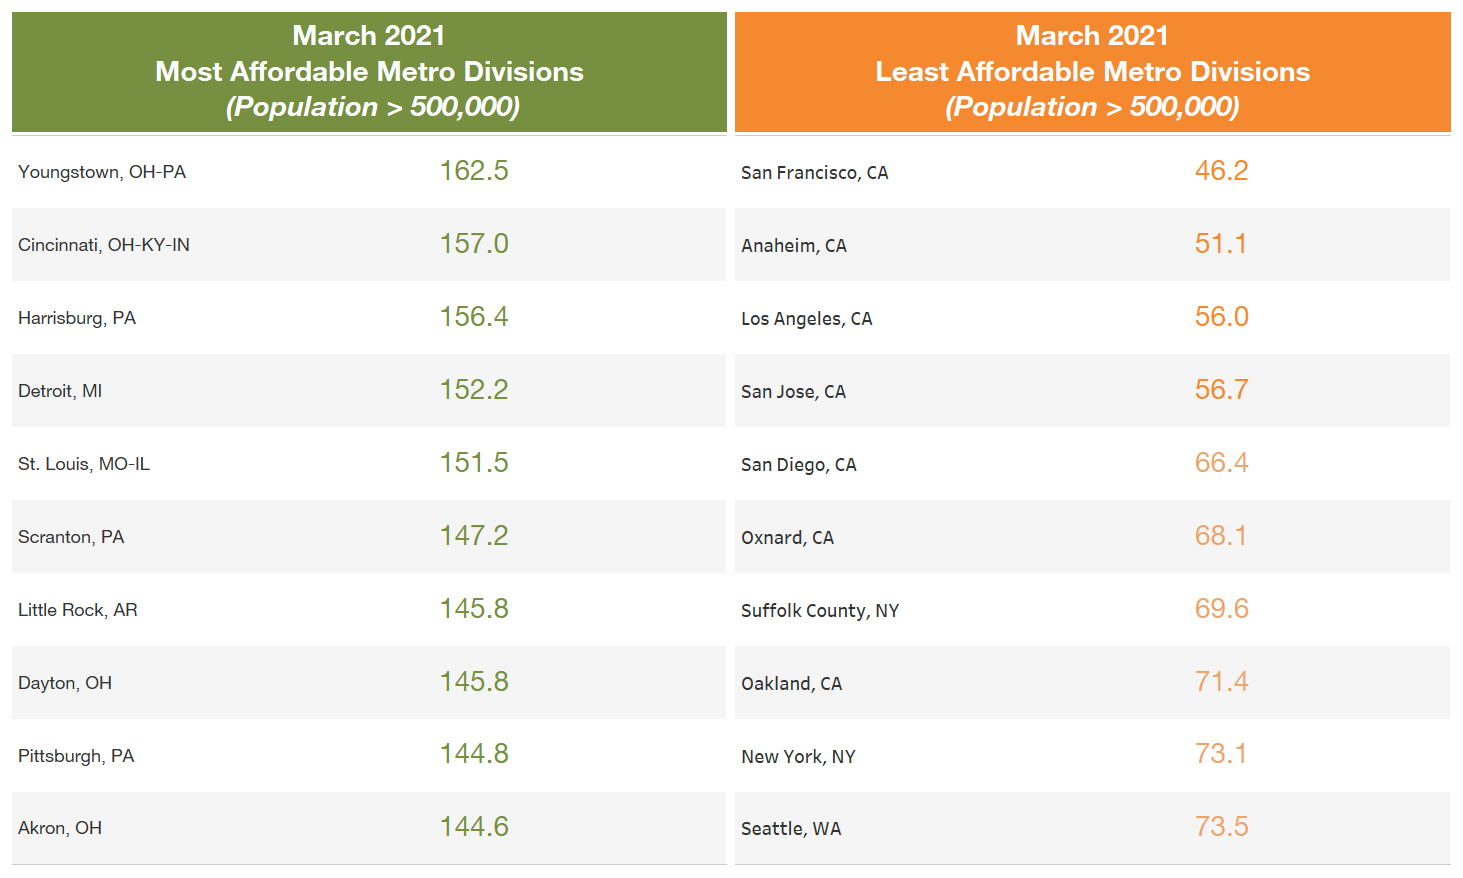
Midwestern U.S. markets tended to rank highest in affordability (see chart 2); four of the 10 most affordable markets are in Ohio (Youngstown, Cincinnati, Dayton, and Akron). Three Pennsylvania metros also made the top 10 (Harrisburg, Scranton, and Pittsburgh). Meanwhile, coastal areas in the west, northeast, and southeast rank lowest in affordability. Seven of the least affordable markets are found in California, including San Francisco, Anaheim, and Los Angeles. Outside of California, Suffolk County on New York’s Long Island, New York City, and Seattle round out the 10 least affordable metro divisions.
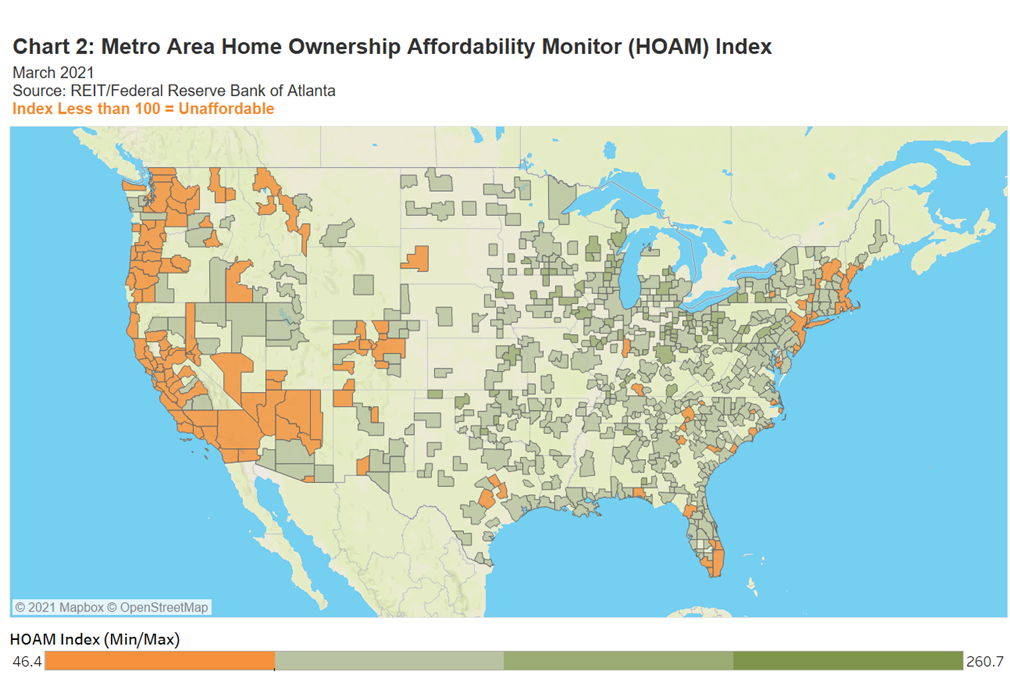
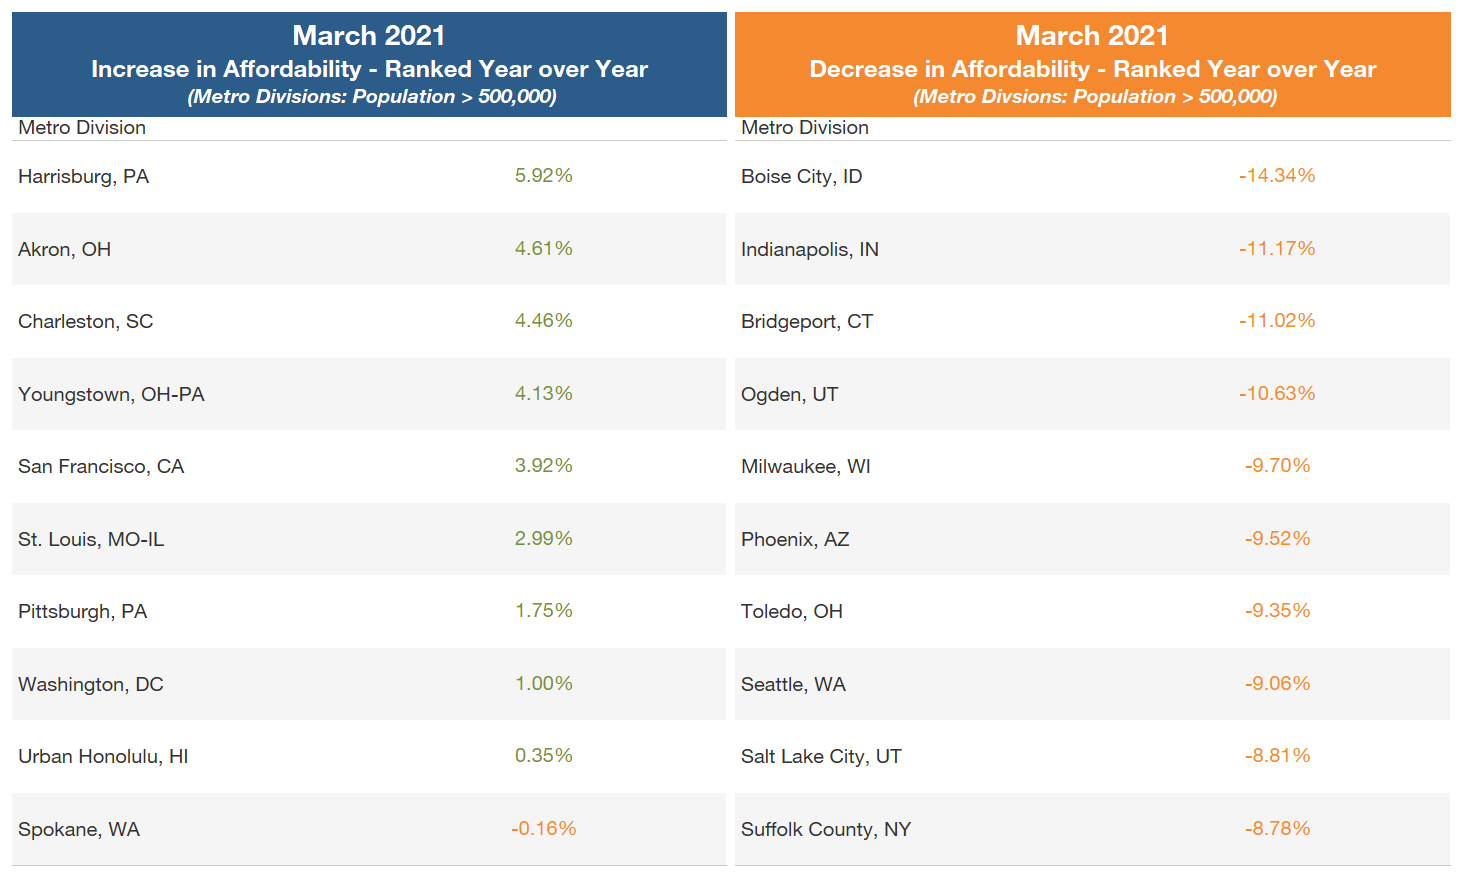
Overall, only 21 percent of metro areas tracked by HOAM were unaffordable in March 2021 (with the cost of home ownership below the HUD affordability threshold of 30 percent of median incomes in the region). However, as home prices and interest rates have risen, 81 percent of HOAM markets saw a deterioration in affordability over the past year (see the chart). Boise City, Idaho, had the sharpest decline, with affordability down by 14.3 percent. Meanwhile, Harrisburg saw the strongest improvement, with affordability rising 5.92 percent over the past year. In markets with improved affordability, home-price growth has been more moderate.
Additional increases in mortgage rates would further erode affordability, especially if prices keep rising. According to Bankrate.com, the benchmark 30-year fixed mortgage rate was 3.09 percent on May 26. That rate would equate to a monthly payment of about $1,205 on a $200,000 mortgage (including principal, interest, taxes, and insurance). If mortgage rates were to rise to four percent with no other changes, for example, that monthly payment would climb to $1,298.
National housing market roundup
Here’s a look at recent trends with important housing sector indicators.
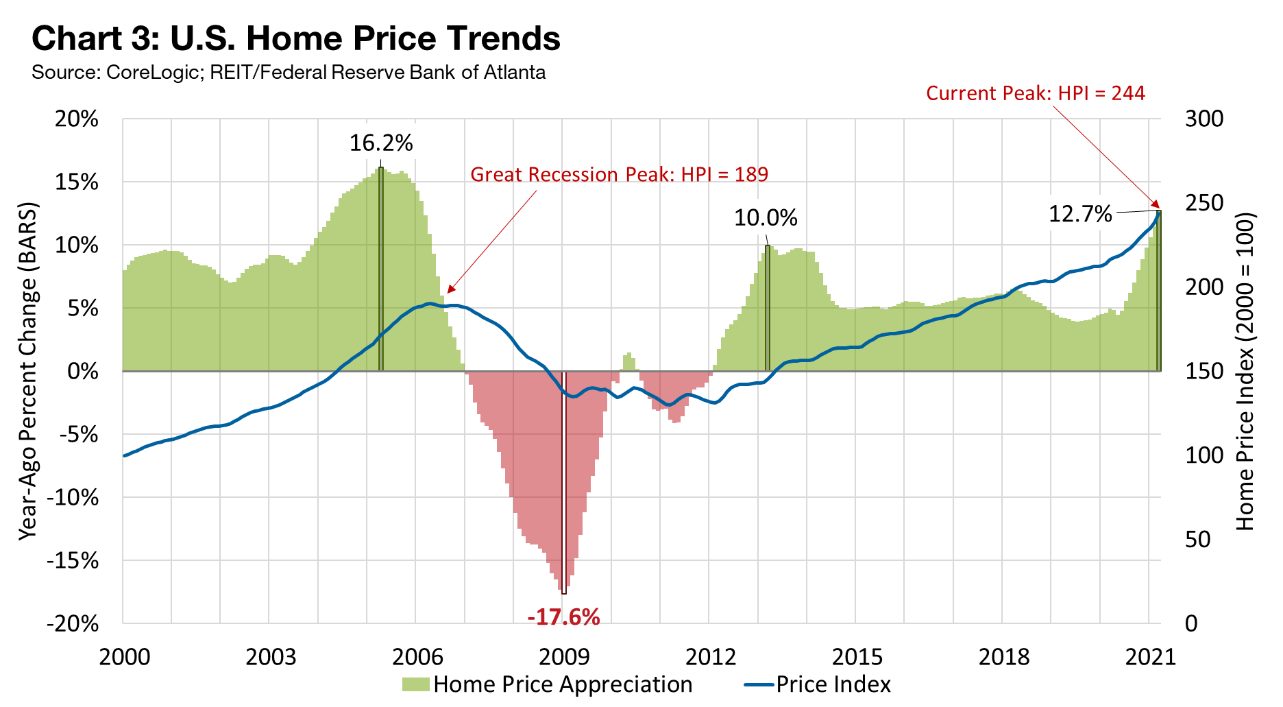
Home Price Appreciation: In March, home prices rose 12.7 percent year-over-year (see chart 3). This level marked the highest growth since 2005, when prices jumped 16.2 percent. While the share of U.S. metro areas with double-digit percentage gains in home prices fell slightly from February to March 2021, on a year-ago basis, the share surged from 29 percent in March 2020 to 59 percent in March of this year (see chart 4).
Inventories: The current housing cycle has been marked by a seemingly inexorable decline in inventory, and data suggest this trend is continuing. In the 12 months ending April 2021, the inventory of homes for sale fell by more than half, according to Redfin, a national real estate brokerage. Subsequently, the supply of available homes plummeted to just 1.1 months, showing that demand greatly exceeds supply (see chart 5). Generally, a four-to-six-month supply of inventory is considered balanced.
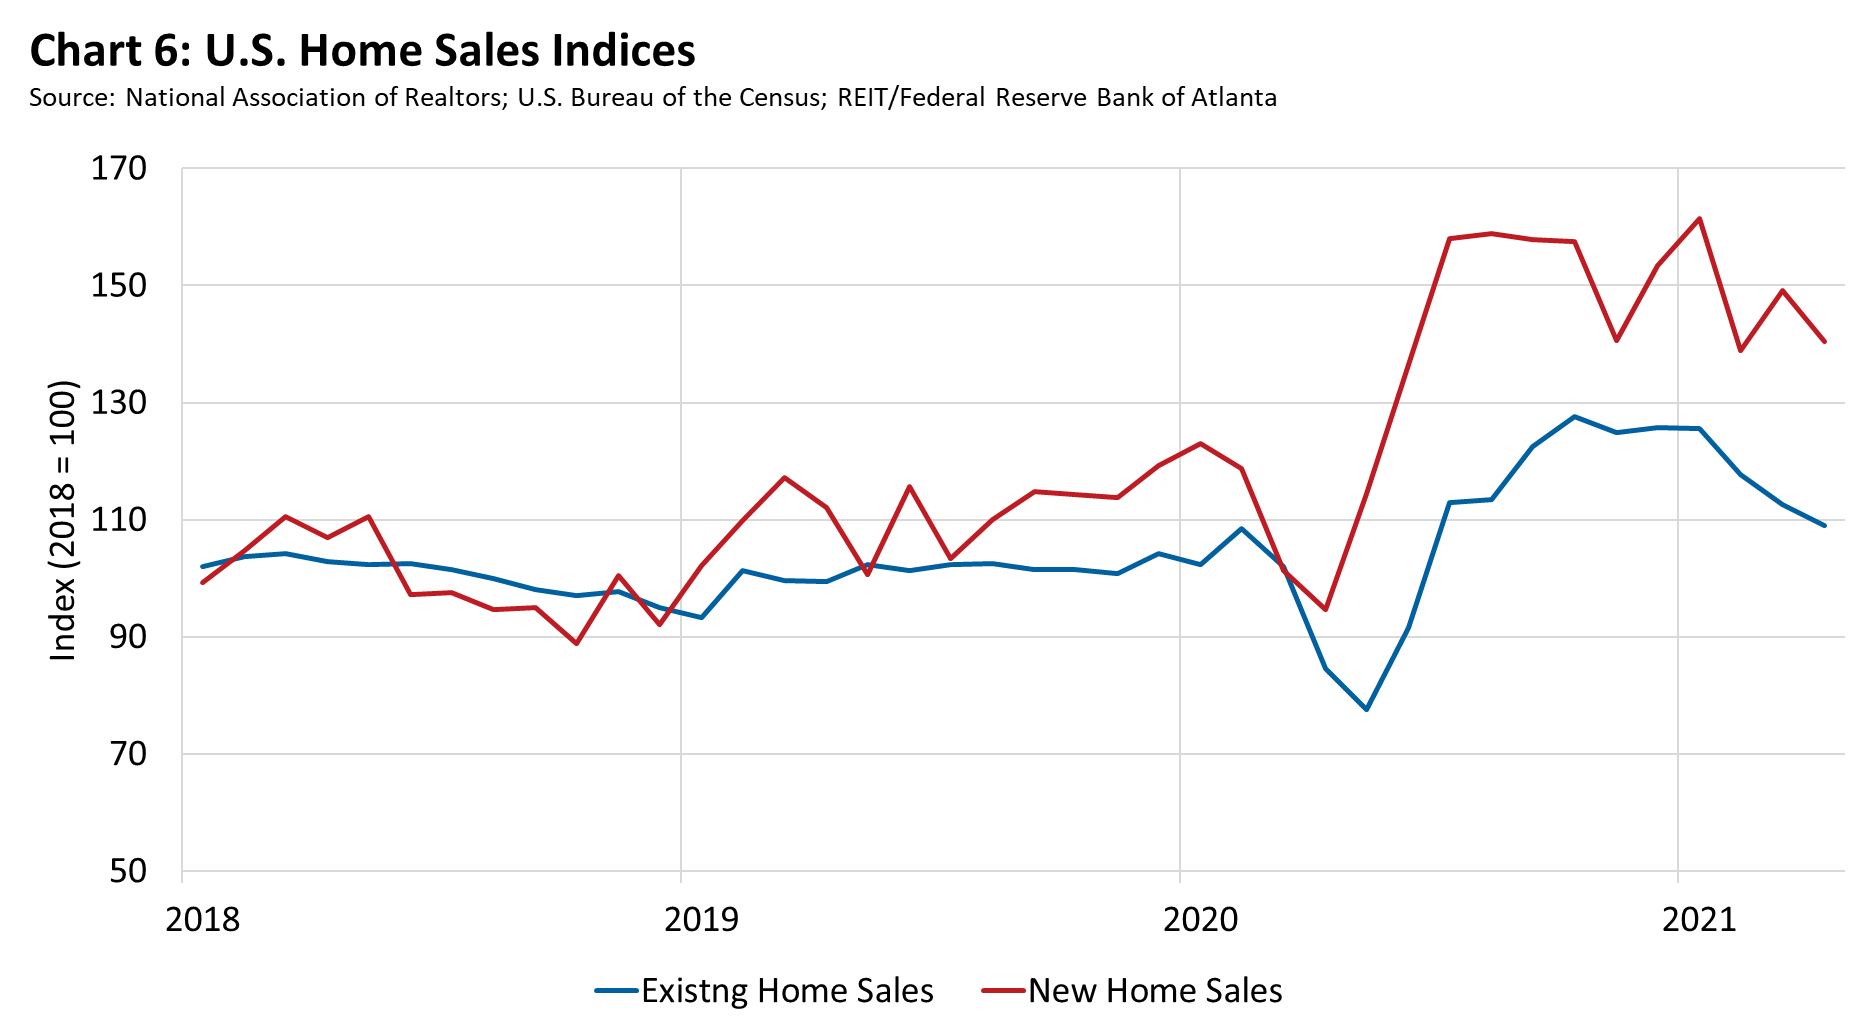
Home Sales: After falling early in the pandemic, home sales increased sharply starting in midyear 2020, bouncing up and down as COVID-19 cases ebbed and flowed in the fourth quarter. Sales of existing homes began to fall in January 2021 and continued to decline through April. In contrast, sales of new homes have been more sporadic; they peaked in January 2021, fell in February, rose again in March and then dropped in April (see chart 6). The decrease in existing home sales, as well as sporadic sales trends in the new home sector, correlates with the decline in available inventory.
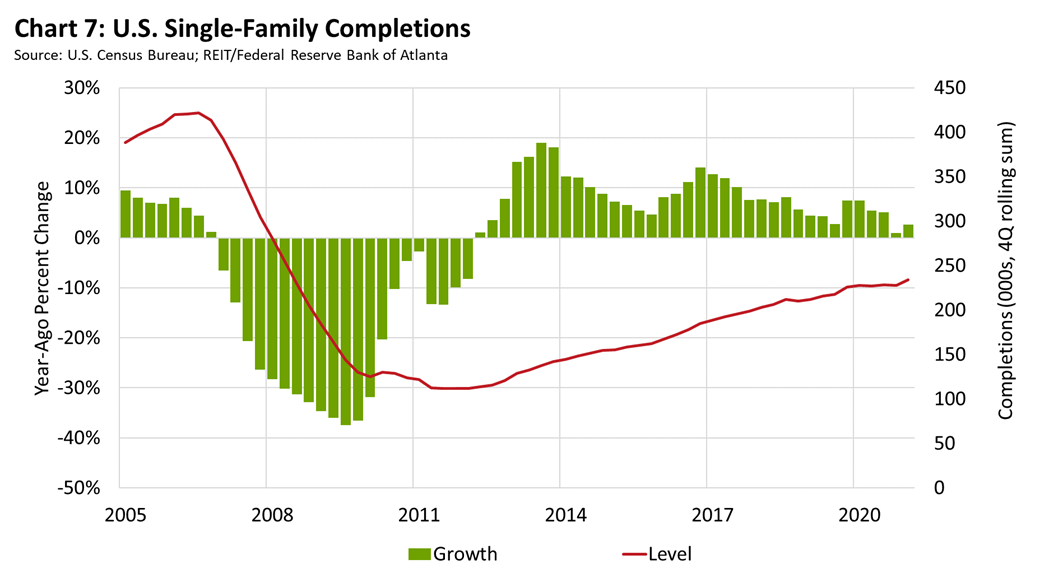
Construction Activity: Construction activity leveled off last year as material and labor constraints tied to homebuilding during the pandemic continued to affect capacity within the sector. By the fourth quarter of 2020, construction was nearly flat on a year-ago basis despite rising demand for new housing (see chart 7). Data from real estate consultant Zonda Intelligence showed that Texas continues to dominate homebuilding nationally; the state includes four of the top 10 markets (Dallas-Fort Worth, Houston, Austin, and San Antonio) for new home completions. Atlanta; Phoenix; Washington, D.C.; Charlotte, North Carolina; and the Florida cities of Orlando and Tampa rounded out the top 10 new construction markets.
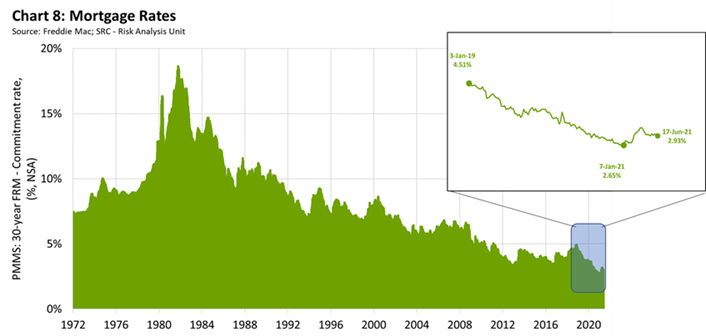
Mortgage Rates and Underwriting: According to Freddie Mac, 30-year fixed mortgage rates stood at 3.00 percent on May 20, up from a historic low of 2.65 percent in early January (see chart 8). Though rates are still low by historical standards, the recent increase, coupled with sharply rising home prices, are taking a toll on housing activity. According to the Mortgage Bankers Association, higher rates and prices, in addition to the limited amount of homes available to purchase, have led to a decline in mortgage applications for purchases and refinancing. A Federal Reserve survey of senior loan officers in April found that, on net, banks reported stronger demand for most types of residential real estate loans for the first quarter, but recent results from consumer surveys in May indicate a decline in consumer sentiment, largely linked to inflation. This could diminish planned expenditures and impact plans to purchase homes in the near term.
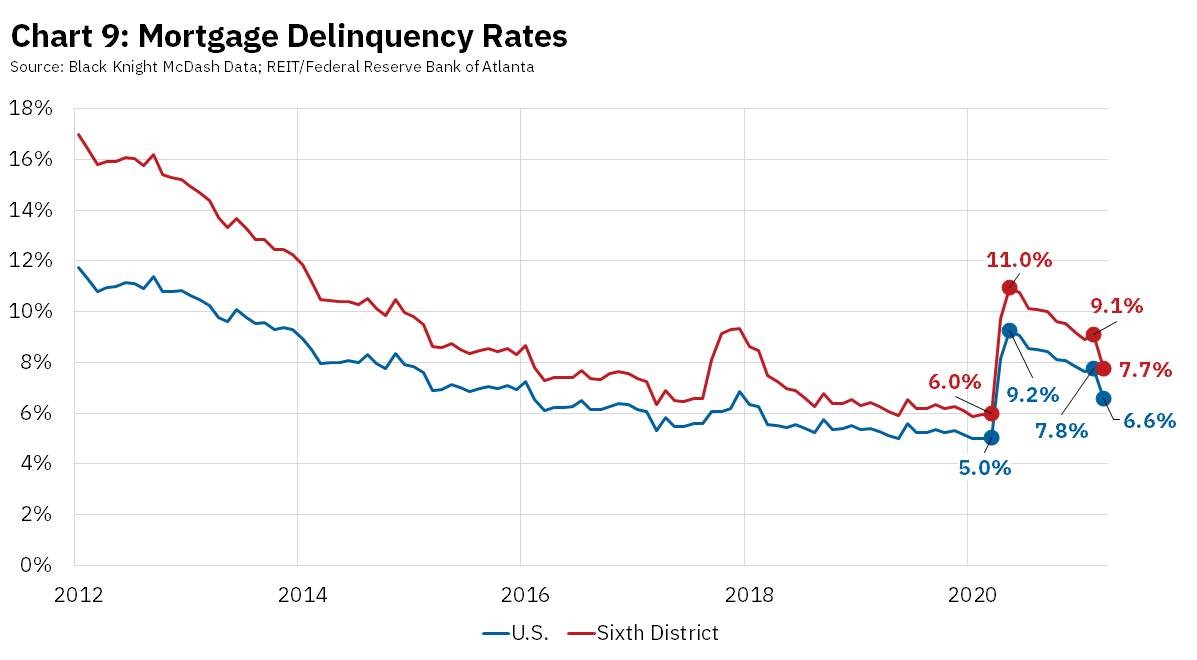
Mortgage Delinquencies: At the onset of the pandemic, national mortgage delinquencies jumped to 8 percent in April 2020 from 4.9 percent the previous month. Though the number of people behind in their payments drifted down for the remainder of 2020, delinquencies rose at the beginning of 2021. While delinquencies remain above prepandemic levels, conditions are improving (see chart 9). As mortgages roll off forbearance plans, lenders have reported that most borrowers have resumed payments as expected, a factor that may account for the fall in delinquencies. As plans continue to expire, it remains to be seen if this performance will continue. For now, federal forbearance guidelines have helped stave off a rise in foreclosures. Still, the Consumer Financial Protection Bureau (CFPB) recently warned mortgage servicers to dedicate sufficient resources and staff to prepare for a surge in borrowers who will need help when federal emergency mortgage protections lapse this summer and fall. The CFPB is seeking comment on a proposal that would generally prohibit servicers from starting foreclosure proceedings until after December 31, 2021.
A note on revised income projections
This month, the HOAM Index is using improved income data and projections from the Atlanta Fed’s Real Estate Intelligence Team (REIT) in the Supervision, Regulation and Credit Division. The additional data more accurately gauge median household income trends. Data revisions had a distinct impact on the national affordability index. New median household income estimates have been revised upward, a factor that may have been influenced by aspects of the recovery in employment or fiscal stimulus programs. According to data from Opportunity Insights' Economic Tracker, employment among higher-income segments (greater than $60,000) has recovered to prepandemic levels, while employment among lower-income groups lags.
Let's Have a Conversation about Housing Affordability
We appreciate the feedback we have received about the HOAM index over the past year. We want to provide more opportunities to connect with readers and start a conversation to further develop our tools. To make it easier to reach us, we welcome you to email us at realestatecenter@atl.frb.org.
We invite you to share comments and questions on the following:
- What is HOAM telling you about your market’s affordability?
- What issues would you like for us to spotlight?
- Would ZIP code-level information be useful?
- Would you be interested in participating in a monthly broker or builder survey of housing market conditions?
Please keep in touch so we can learn and build a better index. You can subscribe to receive HOAM updates here. Choose “Home Ownership Affordability Monitor” in the Data & Analysis category.
Previously, the HOAM index relied on median household income projections based on the Census Bureau's American Community Survey (ACS) one-year estimates. For metropolitan areas and the nation, we used an analytical technique based upon employment levels, unemployment rate, and a time factor to predict income to the most recent employment and unemployment rate data (which lags about two to three months). For county projections, we analyzed actual income data (not projections, as above) to determine the trend. Readers will likely see further revisions to income projections in 2021 as more Census data become available.
For more details, including metro level analysis, please visit the interactive Home Ownership Affordability Monitor.

Domonic Purviance
a subject matter expert in the Atlanta Fed’s Supervision, Regulation, and Credit Division