
Key points
- Home ownership affordability declined for the fifth consecutive month as home prices reached a new record.
- Among all U.S. metros, 23 percent were unaffordable based on the Atlanta Fed’s HOAM index, up from 16 percent a year ago.
- Markets that tend to attract new residents from higher-cost regions continued to post the sharpest year-over-year declines in affordability.
- Eroding affordability is starting to slow home sales in many markets.
National affordability
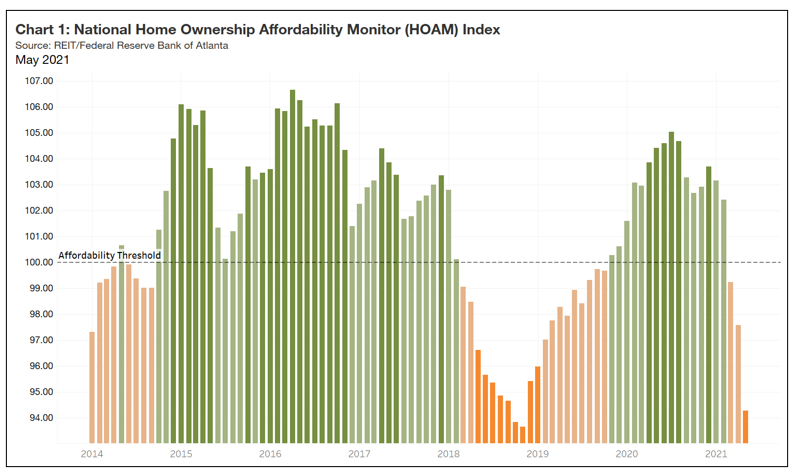
Despite historically low interest rates, home ownership affordability continued to erode nationally as well as in most metro areas in May. The Federal Reserve Bank of Atlanta’s national Home Ownership Affordability Monitor (HOAM) index fell from 97.58 in April 2021 to 94.29 in May (see chart 1). An index reading below 100 is an indication that the cost of owning an area's median-priced home is no longer affordable to households earning the median income. As of May, median home prices peaked at $330,500 on a three-month moving average, a record 21.6 percent increase from a year earlier. At the same time, the median income was estimated to be around $66,740. With home prices reaching record levels, the median-income household would pay about 32 percent of its income to own the average-priced home, a level that exceeds the 30 percent affordability threshold set by the U.S. Department of Housing and Urban Development.
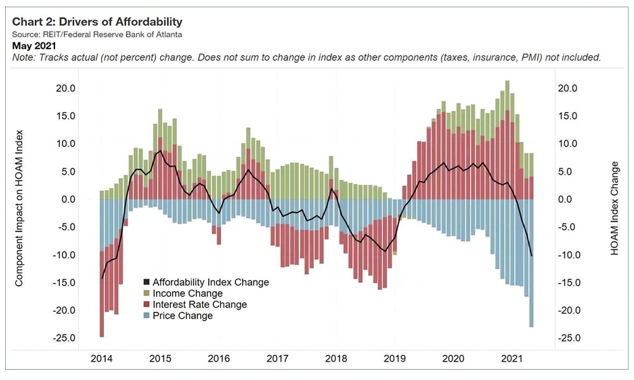
Year over year, affordability dropped by 10.13 percent, marking the sharpest fall since 2018 (see chart 2). Unlike previous declines, which primarily followed spikes in interest rates, sharply rising home prices have mainly driven recent deteriorating affordability. Interest rates have fallen 30 basis points from May 2020 and remain near historic lows. The HOAM index indicates that the increase in home prices outweighed the gains in affordability offered by lower interest rates.
Regional affordability
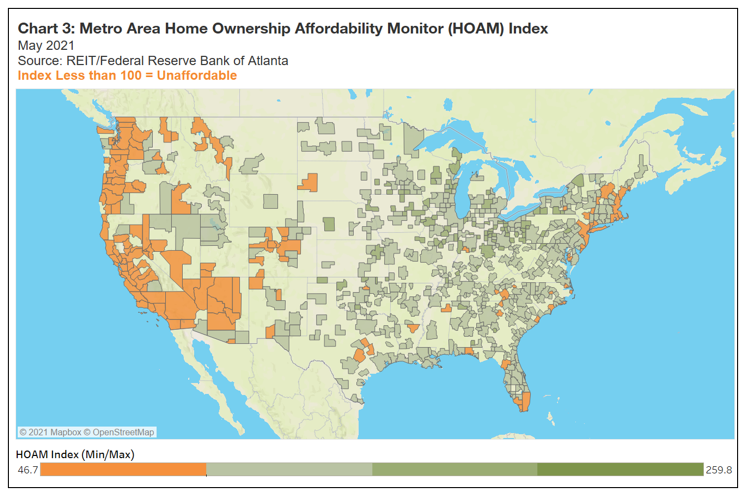
Nine of the 10 least affordable metropolitan areas in May were in California, with the New York-Newark-Jersey City area ranking sixth (see the table). With home prices at record levels in these markets, many current homeowners have decided to sell and move to lower-cost areas. At the same time, a majority of the 10 most affordable metros were clustered in Ohio and Pennsylvania (see chart 3). Other affordable areas included Des Moines-West Des Moines, Iowa; St. Louis, Missouri-Illinois; Little Rock-North Little Rock-Conway, Arkansas; and Syracuse, New York. Although prices may have increased in these markets, home prices remained moderately affordable to households earning the median income.
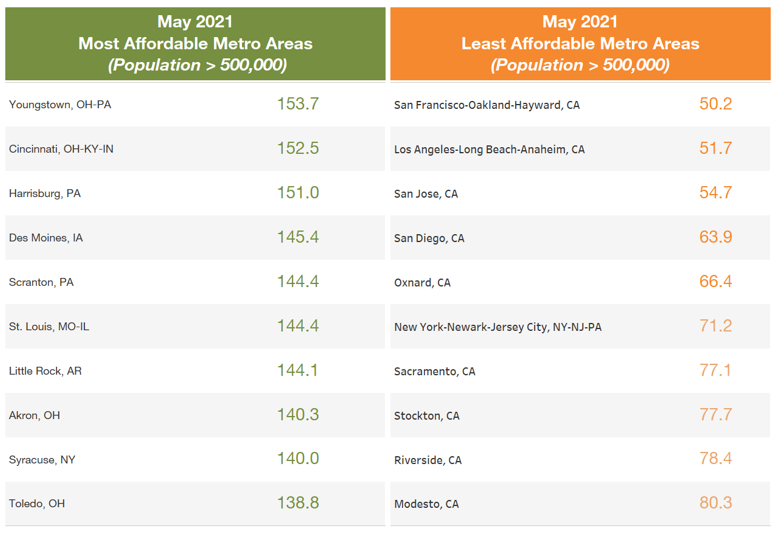
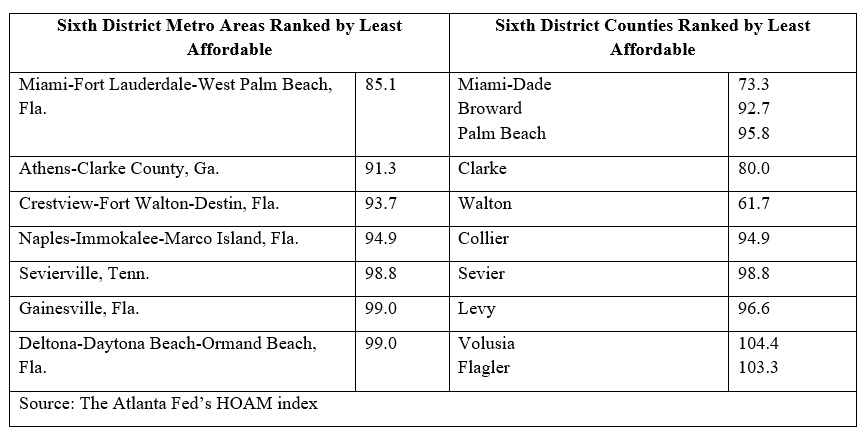
In the region supervised by the Atlanta Fed, which includes Florida, Georgia, Alabama, and parts of Mississippi, Louisiana, and Tennessee, markets in South Florida remained the least affordable (see the table). In addition, college towns such as Athens, Georgia, and Gainesville, Florida—the locations of the universities of Georgia and Florida, respectively—had lower affordability.
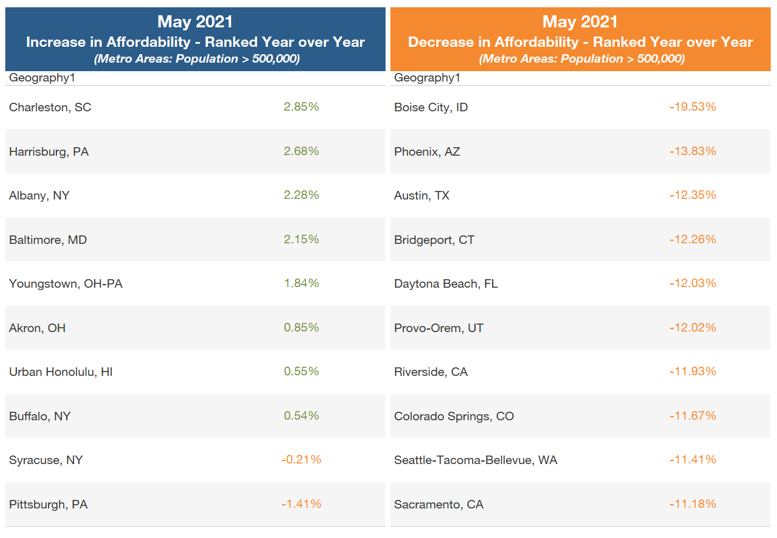
About 82 percent of U.S. metro areas had a decline in affordability during the past year. Markets like Charleston, South Carolina; Harrisburg, Pennsylvania; Albany, New York; and Baltimore, Maryland, saw an increase in affordability mainly because home prices remained flat or only increased moderately. On the other hand, metros such as Boise City, Idaho; Phoenix, Arizona; Austin, Texas; and Bridgeport, Connecticut, experienced a sharp increase in home prices, which significantly hurt affordability. In Boise City, for example, home prices rose 33 percent in the past year, resulting in a 19.5 percent drop in home ownership affordability. Boise City, Phoenix, and Austin have seen a surge of new residents moving into the region from higher-cost coastal markets. Many of these new residents have recently sold homes with a significant amount of equity and have ample cash to put toward a home purchase.
National housing market roundup
Here's a look at recent trends with important housing sector indicators
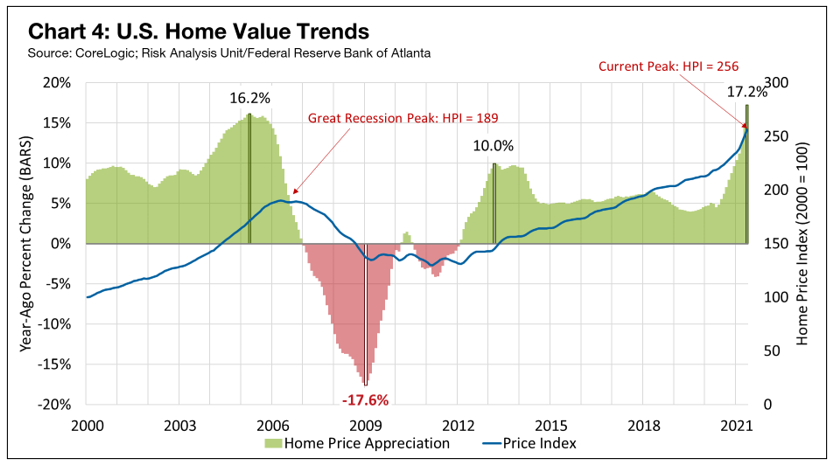
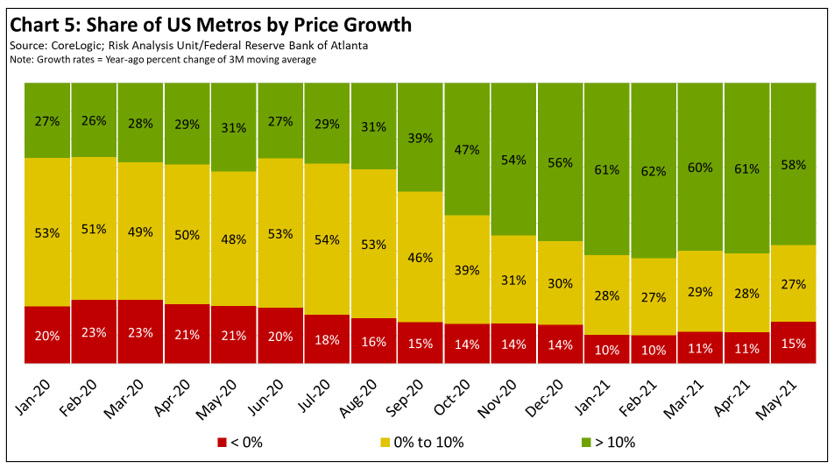
- Home Price Appreciation: As the price of homes for sale reached peak levels, the values of houses that are not on the market have soared. In May, home values rose 17.2 percent year over year (see chart 4), the highest level of appreciation since 2005, when values jumped 16.2 percent. While the share of U.S. metro areas with double-digit percentage gains in home values fell slightly from February to May, it remains high at 58 percent (see chart 5).
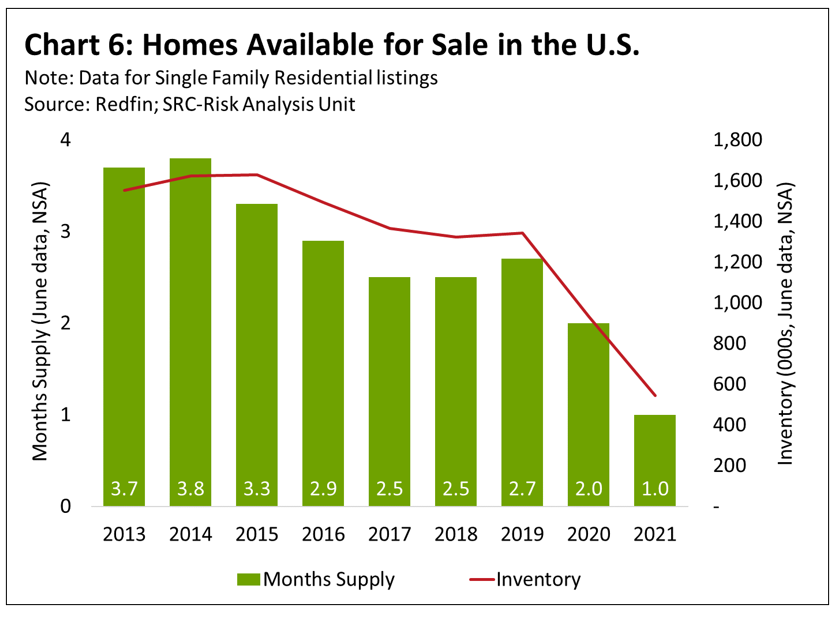
- Inventories: Significant inventory shortages remain a challenge in many markets. In the 12 months ended in May 2021, the inventory of homes for sale fell more than half, according to Redfin, a national real estate brokerage. As a result, the supply of available homes plummeted to just one month as demand continues to greatly exceed supply (see chart 6). Generally, an inventory supply of four to six months is considered balanced. Supply levels have tightened because the number of homes for sale has not kept pace with the growing demand for housing. Supply has further eroded recently as pandemic-related shutdowns and a surge in refinance activity tied to historically low rates led many homeowners not to sell their houses. The lack of supply has been the strongest driver of the rise in home prices over the past year.
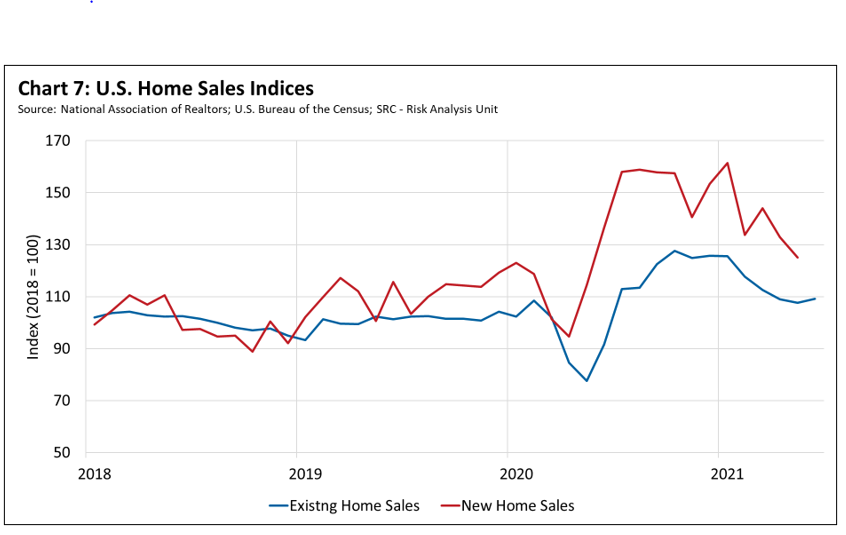
- Home Sales: The weight of inventory and affordability challenges is beginning to affect home sales. Sales of existing homes began to fall in January 2021 and continued to decline through May as the lack of available houses limited sales volumes. New home sales have also trended downward this year (see chart 7). Increased land, labor, and materials costs have led many builders to initially limit the number of sales in order to better manage expenses. Even so, declining affordability is starting to suppress housing demand as more and more buyers begin to indicate an unwillingness to purchase houses as prices rise sharply.
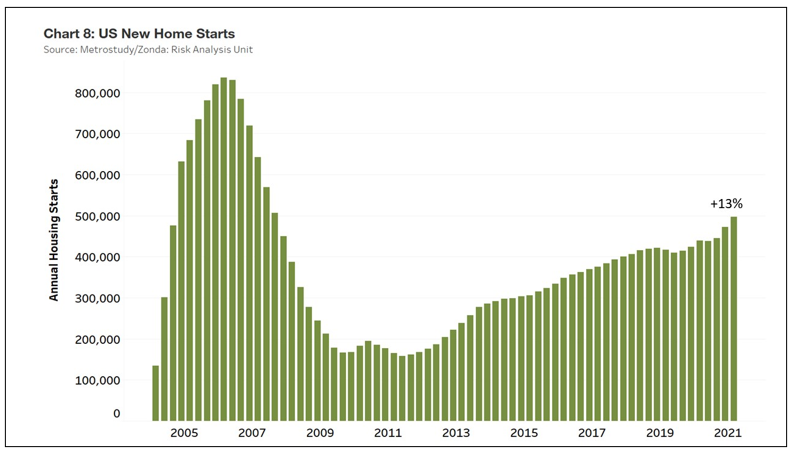
- Construction Activity: Material and labor constraints tied to the pandemic continue to affect construction activity. However, builders have begun to deliver homes that were already on order. As a result, housing starts in the first quarter of the year were up 13 percent from a year earlier (see chart 8). As capacity within the new home construction sector continues to recover, and as many builders elected to limit sales through the spring and summer to help alleviate expense pressures, material costs are starting to decline. For example, lumber prices recently dropped by about 45 percent after spiking during the pandemic. Data from real estate consultant Zonda Intelligence show that Texas continues to dominate homebuilding nationally. The state includes four of the top 10 markets (Dallas-Fort Worth, Houston, Austin, and San Antonio) for new home completions. Atlanta; Phoenix; Washington, DC; Charlotte, North Carolina; and the Florida cities of Orlando and Tampa rounded out that list.
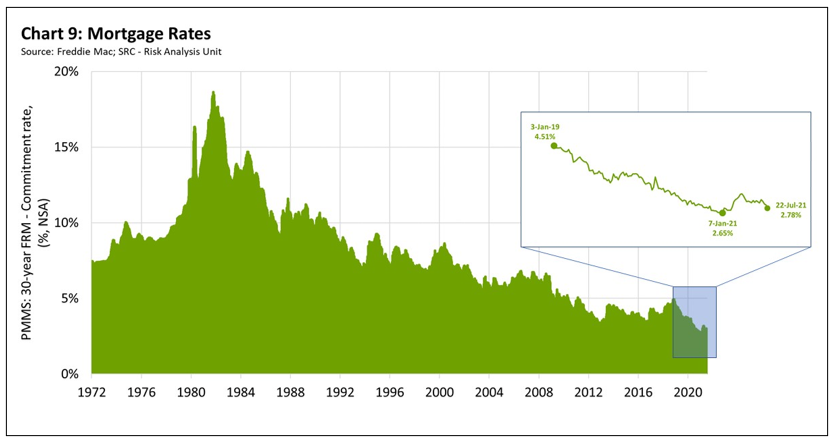
- Mortgage Rates and Underwriting: According to Freddie Mac, 30-year fixed mortgage rates stood at 2.78 percent on July 21. This rate is up slightly from a trough of 2.65 percent in early January, but rates remain significantly low by historic standards (see chart 9). Even so, according to the Mortgage Bankers Association, slightly higher rates and sharply higher prices led to steady declines in mortgage applications for purchases and refinancing in May. Although a Federal Reserve survey of senior loan officers in April found that banks reported stronger demand for most types of residential real estate loans for the first quarter, recent results from consumer surveys in May indicate a decline in consumer sentiment largely linked to inflation. Lower sentiment could diminish planned expenditures and affect plans to purchase homes in the near term.
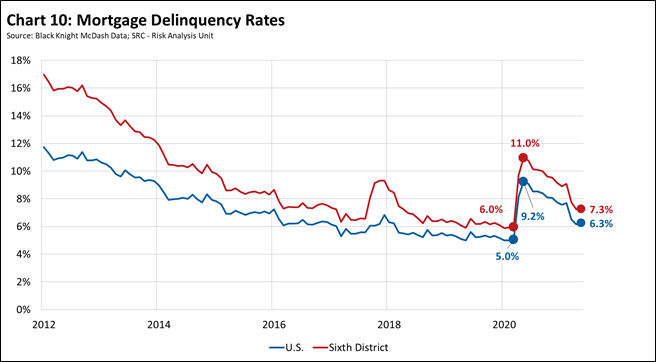
- Mortgage Delinquencies: Though delinquencies remain above prepandemic levels, conditions are improving as more and more borrowers return to making payments (see chart 10). Since the peak in delinquencies last year, mortgages have steadily rolled off forbearance plans, and lenders have reported that most borrowers have resumed payments. As forbearance plans continue to expire, it remains to be seen if this performance will continue. For now, federal forbearance guidelines coupled with favorable home equity positions have helped stave off a wave of foreclosures. Still, the Consumer Financial Protection Bureau (CFPB) recently warned mortgage servicers to dedicate enough resources and staff to prepare for a surge in borrowers who will need help when federal emergency mortgage protections lapse this summer and fall. The CFPB is seeking comment on a proposal that would generally prohibit servicers from starting foreclosure proceedings until after December 31, 2021.
For more details, including metro level analysis, please visit the interactive Home Ownership Affordability Monitor.


