Key points
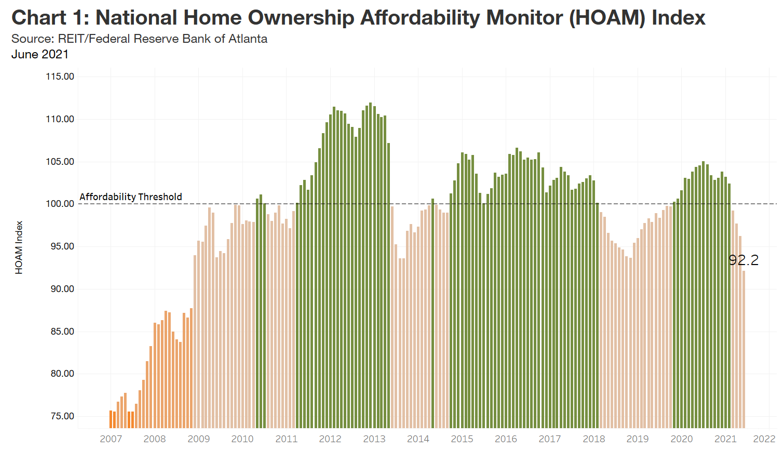
- The national HOAM index stood at 92.2 in June, its lowest level since 2008.
- National housing affordability fell 11.9 percent in June, the sharpest drop since 2014.
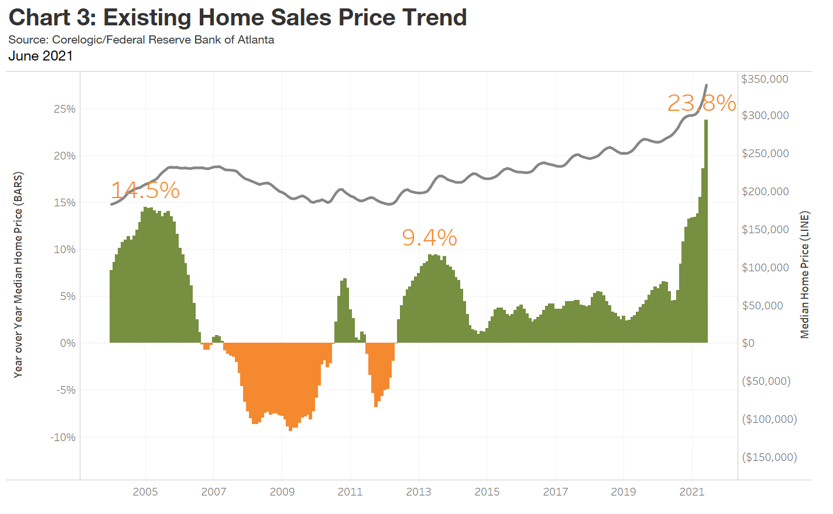
- Home sale prices were up 23.8 percent over the past year.
- On average, a median-income household would need to spend 32.6 percent of its annual earnings to own a median-priced home.
- Although demand for housing remains strong, steadily declining affordability is beginning to affect buying decisions.
The latest reading of an Atlanta Fed measure and US housing trends show home ownership is becoming out of reach for many buyers and resistance to higher prices is building. More than 80 percent of US metro areas had a drop in affordability.
National affordability
With a 92.2 rating in June, the Federal Reserve Bank of Atlanta’s Home Ownership Affordability Monitor (HOAM) index fell to its lowest level since 2008 (see chart). The index fell below 100 in March and has remained there. A reading below 100 indicates that a median-income household can no longer afford to own a median-priced home on the market. Over the past year, the index shows that US home ownership affordability dropped by 11.9 percent as prices soared. In June, median existing home sale prices rose above a record $340,000 (three-month moving average), according to data provider CoreLogic. This valuation represents a 23.8 percent increase over the past 12 months, one of the highest year-over-year price gains on record. Even with relatively low 30-year fixed interest rates (2.87 percent in August), a median-income household would spend 32.6 percent of its annual income to own a median-priced home, which is above the 30 percent affordability threshold set by the US Department of Housing and Urban Development.
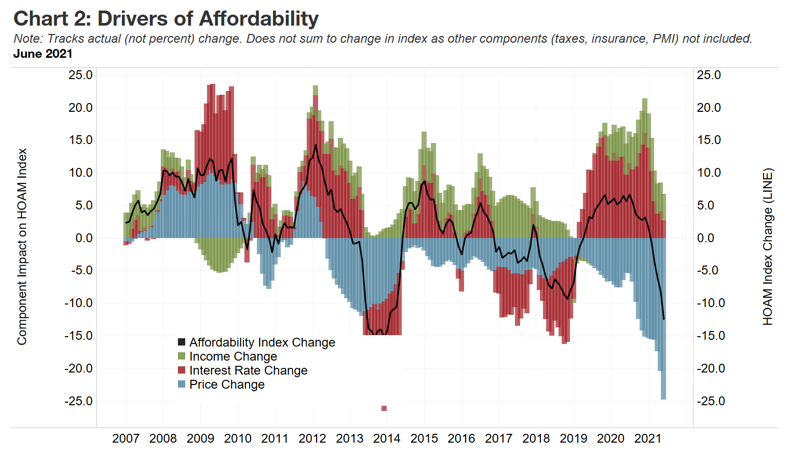
Following the onset of the pandemic in March and April 2020, declining mortgage interest rates became the primary catalyst for a surge in housing demand. Although home sale prices began to rise during the pandemic, lower rates were more than enough to offset the higher cost burden for consumers. In addition, greater income growth as the US economy emerged from COVID-19-related shutdowns helped maintain affordability as prices rose. However, this trend began to shift in 2021, when sale prices reached peak levels and low interest rates and higher incomes could no longer offset the increased cost (see chart). As a result, home ownership affordability began to weaken significantly.
Regional affordability
Markets in Ohio and Pennsylvania dominated the ten most affordable metro areas. To a large degree, they have seen relatively modest growth in home sale prices. For example, in the Youngstown-Warren-Boardman metro area—the nation’s most affordable large metro, according to HOAM—the median home sales price ($138,875 in June) remained flat from the year earlier, while prices nationally increased by more than 20 percent. As a result, a median-income household in Youngstown would spend only 19 percent of its annual income ($49,258) to own a median-priced home, the lowest home ownership cost among the nation’s largest metros (population greater than 500,000).
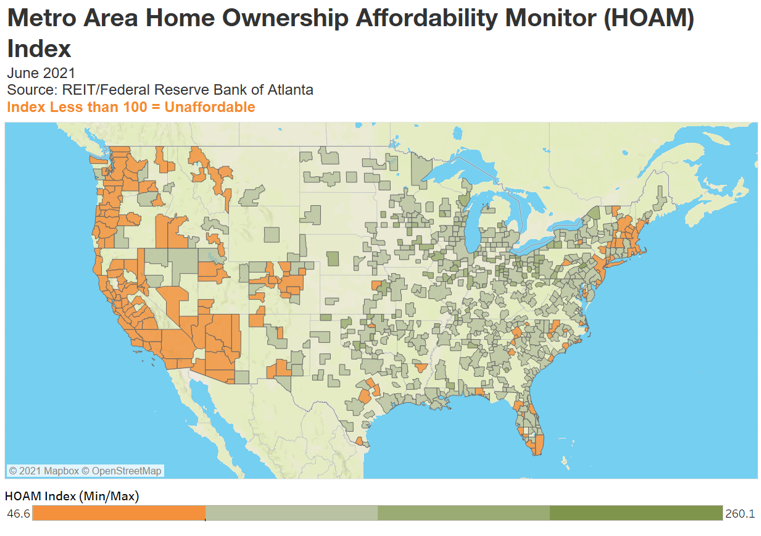
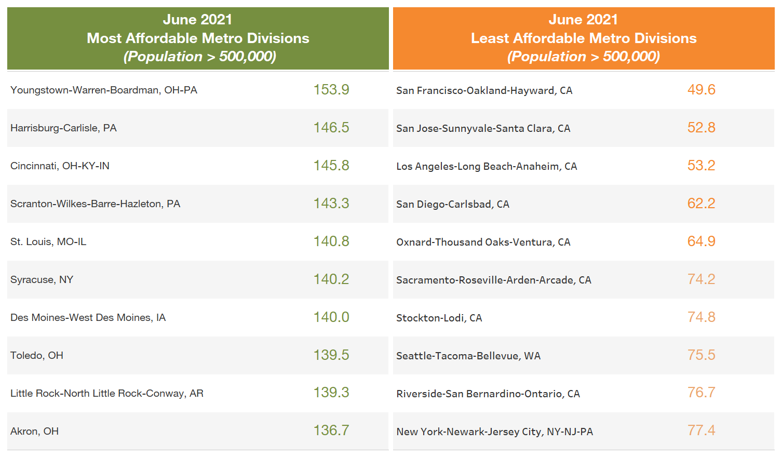
Eight of the country’s 10 least affordable markets were in California. Historically, markets in northern California (San Francisco-Oakland-Hayward and San Jose-Sunnyvale-Santa Clara) and southern California (Los Angeles-Long Beach-Anaheim and San Diego-Carlsbad) have been among the most expensive large metros in the nation. Although home sales price growth in these areas has not kept pace with national trends, rising prices have been a culprit in eroding affordability. In San Francisco, for example, home prices rose by 7 percent over the past year, well below the national rise of 23.8 percent. However, with median home sale prices reaching a record $1.3 million, a median income household in San Francisco ($118,036) would end up spending 61.5 percent of its income on a median-priced home in the area. It should be noted that, in most cases, households that earn just the median income in a high-cost market like San Francisco would most likely rent rather than own because of the lack of affordable ownership options.
In the region supervised by the Atlanta Fed, which includes Florida, Georgia, Alabama, and parts of Mississippi, Louisiana, and Tennessee, home ownership affordability tends to be much higher thanks to relatively low home sale prices in the region. However, markets in South Florida such as Miami and Naples remained the least affordable. Additionally, as prices have risen across the state of Florida, markets that were previously affordable according to the HOAM index—including Deltona-Daytona Beach-Ormond Beach and North Port-Sarasota-Bradenton—shifted to unaffordable in June. Elsewhere, college towns like Athens, Georgia, home to the University of Georgia, and Gainesville, Florida, the location of the University of Florida, also were among the District’s least affordable markets.
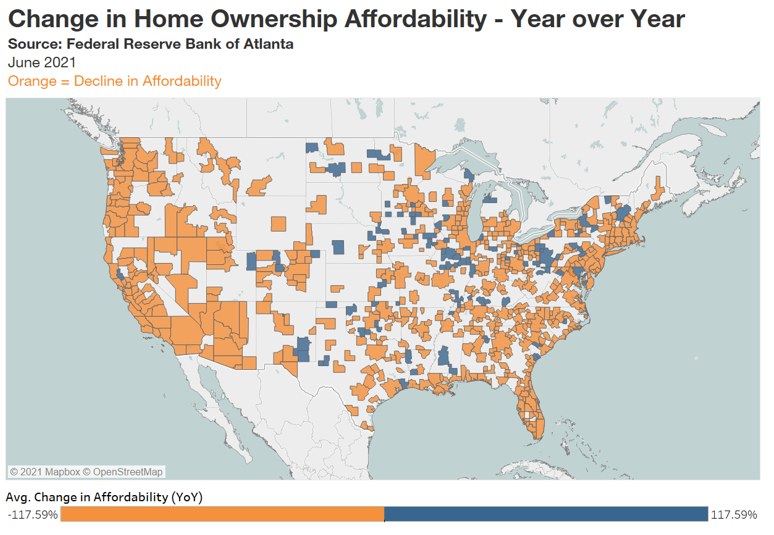
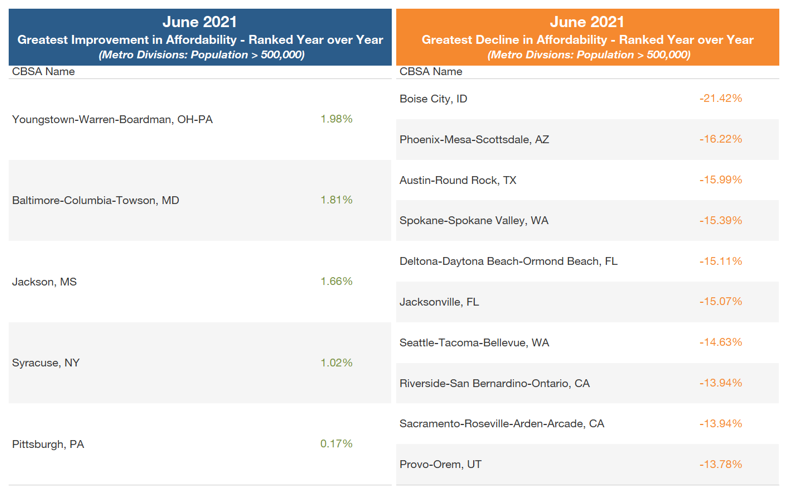
About 82 percent of metro areas had a decline in affordability over the past year. The deterioration was so widespread that only five large metros showed an increase in affordability. In addition to Youngstown, other areas that became more affordable were Baltimore-Columbia-Towson, Maryland; Jackson, Mississippi; Syracuse, New York; and Pittsburgh (see table). For the most part, growth in home sale prices in these markets was not enough to offset the benefit from low interest rates.
On the other hand, sharp rises in home sales prices in markets like Boise City, Idaho; Phoenix-Mesa-Scottsdale, Arizona; and Austin-Round Rock, Texas, led to significant year-over-year decreases in affordability in June. Affordability declined in these metros by 21.4, 16.2, and 16 percent, respectively. At the same time, the median price of homes that sold in all three of these metros rose more than 25 percent over the past year, exceeding the national rate. In most cases, markets with the sharpest decline in affordability had an influx of homebuyers moving from higher-cost markets over the past year. Boise City, for example, was the landing spot for a surge of buyers relocating from coastal California, which drove up home sale prices by 35 percent over the past year. Many of these buyers, having recently sold or cashed out equity on an existing house, tend to have large sums of cash to put toward a new purchase. The increase in remote work since the start of the pandemic also gave greater flexibility to homebuyers in choosing where to live, helping to accelerate relocations from higher-cost markets to lower-cost markets. In many cases, buyers with higher incomes and more cash on hand moving from high-cost markets also have been able to pay more for homes than many local consumers in the areas in which they relocate. These trends have priced many local homebuyers out of the market in cities such as Boise City, Phoenix, and Austin.
National housing market roundup
Here's a look at recent trends with important housing sector indicators.
- Home Price Appreciation: The median existing home price (above $340,000) reached a record level in June 2021 (see chart). At 23.8 percent, the current level of appreciation is the highest on record since 2005, when values jumped by 14.5 percent.
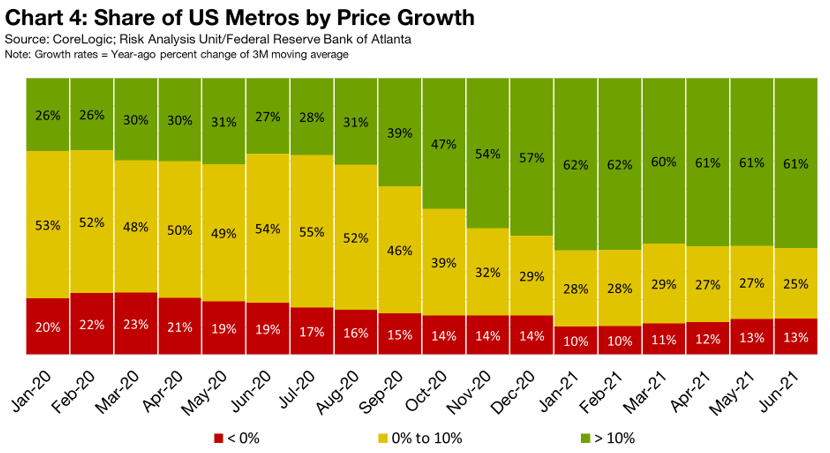
- Meanwhile, the share of metro areas that have experienced double-digit rates of appreciation remains high at 61 percent (see chart).
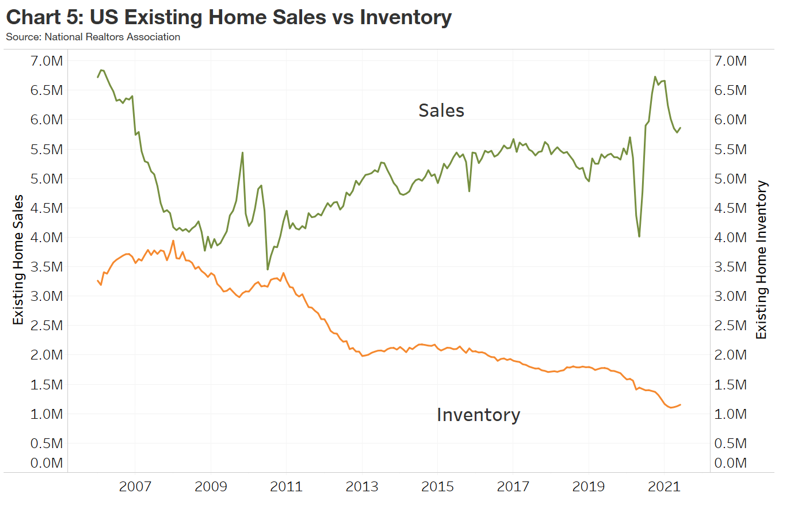
- Home Sales and Inventory: During the past year, housing inventory has consistently trailed demand (see chart). According to the National Association of Realtors, sales over the past year increased 1.5 percent while existing home inventory fell 12 percent. As a result, the national supply of existing home inventory (months it would take to sell the current amount of inventory on the market given the current rate of sales) has been consistently below four months since June 2020. (Note: Anything less than four months is considered a supply shortage.) Existing home inventory reached its lowest point in January, when the supply dropped to 2.1 months. As of July, inventory remained low at 2.6 months. Meanwhile, there are growing signs that demand is softening given the tepid 1.5 percent sales rise in July following increases in double-digit percentages through most of last year and the first half of 2021. The slower pace of home sales is partly due to the of lack of affordable units available as well as concerns about price growth.
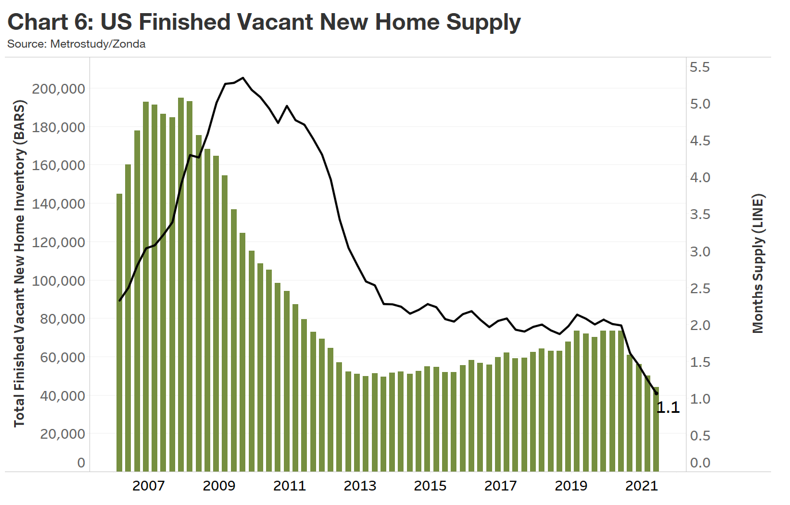
- Construction Activity: Impaired by capacity constraints through most of the pandemic, new home construction has not been able to keep pace with demand. The amount of finished new homes available for sale (or finished vacant inventory) has steadily declined over the past year and ended the second quarter of 2021 at a low supply of 1.1 months, below the supply norm of 2 to 2.5 months since 2013 (see chart). At the same time, new home builders continue to contend with rising costs. Though lumber prices are down from peak levels, labor, land, and other material costs continue to rise. After some builders worked to slow the pace of sales earlier this year to keep ahead of rising costs, many are now moving to resume more normal sales activity.
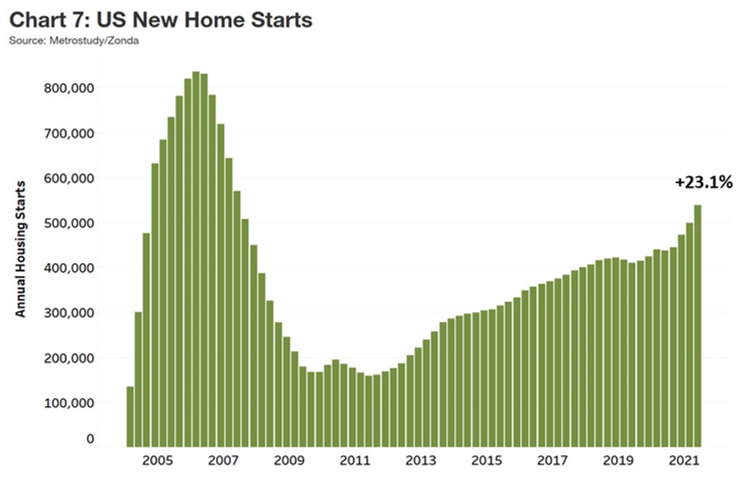
- New Home Starts: Additionally, new home starts rose 23.1 percent in the second quarter over last year as builders ramped up construction activity back to more normalized levels (see chart). However, with affordability becoming more of a concern for buyers, some builders are seeing greater resistance to higher prices.
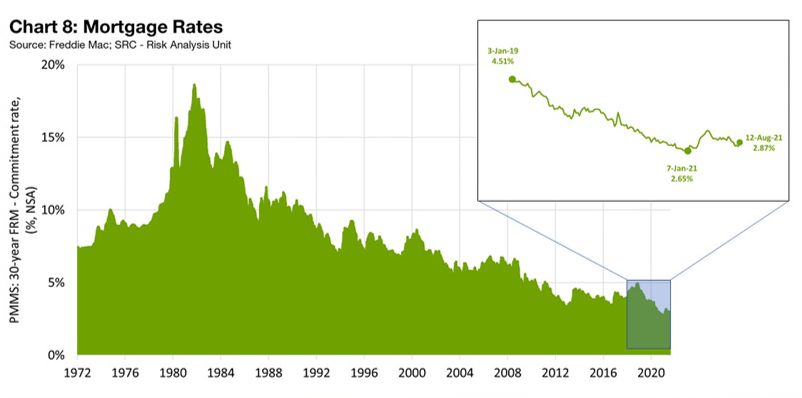
- Mortgage Rates and Underwriting: According to Freddie Mac, 30-year fixed mortgage rates stood at 2.87 percent on August 12, up from a historic low of 2.65 percent in early January but still near all-time lows (see chart). A Federal Reserve survey of senior loan officers in July found that, on net, banks reported that they are easing underwriting standards on most mortgage types. However, more easing was reported with single-family jumbo mortgages (mortgages that exceed GSE loan-servicing limits, currently $548,250 for single-family homes in all states, except for areas designated as high-cost markets, where the limit is $822,375). The relaxation of underwriting standards for higher-end mortgages corresponds with the dwindling supply of affordable homes for sale. At the same time, Fannie Mae’s Home Purchase Sentiment Index (HPSI) fell by 3.9 percent in July as buyers expressed increased concern over higher home prices and the lack of inventory.
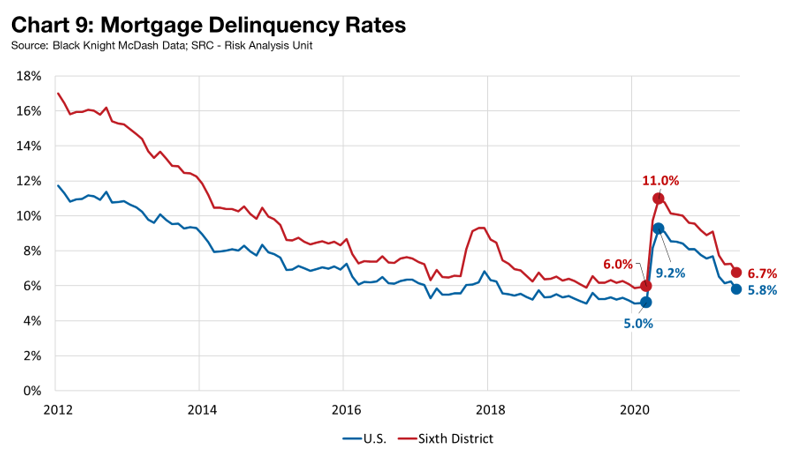
- Mortgage Delinquencies: While delinquencies remain above prepandemic levels, conditions are improving as more and more borrowers return to making payments (see chart). Overall, delinquencies dropped to 5.8 percent from a peak of 9.2 percent last year. In the region covered by the Atlanta Fed, delinquencies are slightly higher at 6.7 percent. Since the high point in delinquencies last year, mortgages have steadily rolled off forbearance plans and lenders have reported that most borrowers have resumed payments as expected. As plans continue to expire, it remains to be seen if this performance will continue. For now, federal forbearance guidelines, coupled with favorable home equity positions, have helped stave off a wave of foreclosures. Still, the Consumer Financial Protection Bureau (CFPB) recently warned mortgage servicers to dedicate sufficient resources and staff to prepare for a surge in borrowers who will need help when federal emergency mortgage protections lapse this summer and fall. The CFPB is seeking comment on a proposal that would generally prohibit servicers from starting foreclosure proceedings until after December 31, 2021.
For more details, including metro level analysis, please visit the interactive Home Ownership Affordability Monitor.


