
Key points
- National home ownership affordability fell 11.1 percent in July, the sharpest decline since 2013.
- Home price appreciation moderated in July, increasing 17.6 percent over the past year.
- A median-income household would need to spend 32.1 percent of its earnings to own the median-priced US home, the highest cost of ownership since 2008.
- Buyer sentiment is starting to weaken as concerns about decreasing affordability continue to rise.
Higher prices remain the most significant hurdle to home ownership for median-income households, the latest reading of an Atlanta Fed measure shows. For a growing share of consumers, higher home prices have negated the benefits from low interest rates and wage growth.
National affordability: Average home price tops $340,000
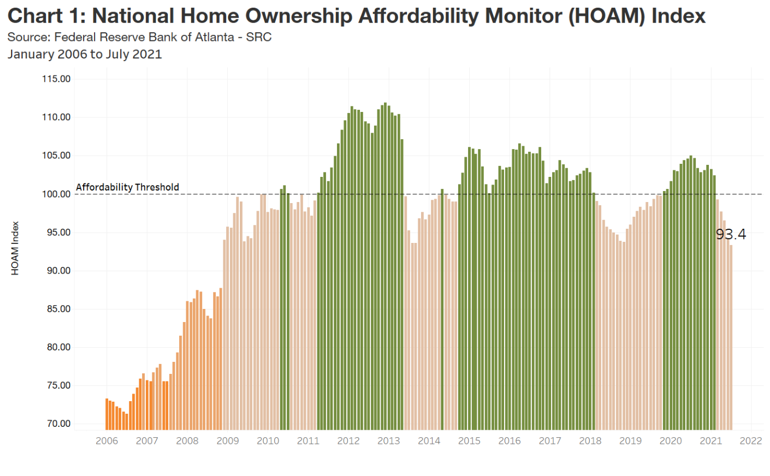
With a 93.4 rating in July, the Federal Reserve Bank of Atlanta’s Home Ownership Affordability Monitor (HOAM) index fell to its lowest level since 2008 (see chart 1). A HOAM index reading below 100 is an indication that a median-income household cannot absorb the costs of owning a median-priced home on the market. The HOAM index has remained below 100 since March. Over the past year, US home ownership affordability dropped 11.1 percent as home prices sustained upward movement. Although the pace of home price growth has lessened, the median existing home sales price tag continues to increase, reaching a record $342,350 (three-month moving average) in July, according to data tracker CoreLogic. Despite still low 30-year fixed mortgage rates, the median-income US household would need to spend 32.1 percent of its annual income to own the median-priced home, above the 30 percent affordability threshold recommended by the federal Department of Housing and Urban Development.
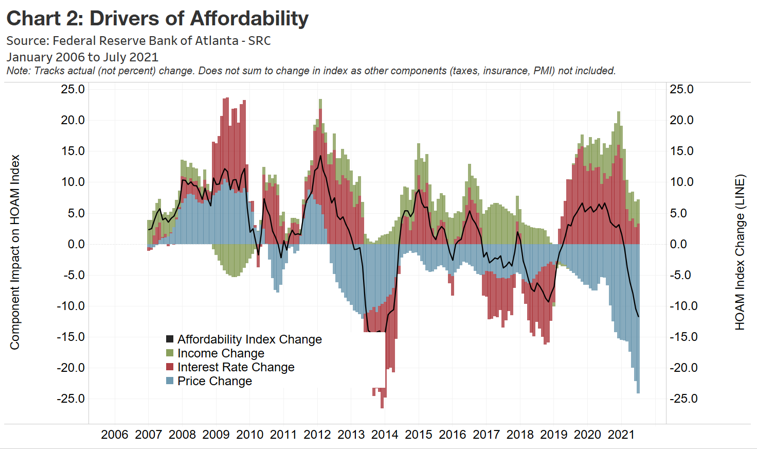
Historically low interest rates remain the primary driver of housing demand. Improving wage growth as the economy emerges from the coronavirus pandemic has helped households that are considering purchasing a home. However, for a growing share of those looking to purchase a home, rising home prices have erased the benefits of low rates and wage growth. (see chart 2).
Regional affordability: Midwest stands out
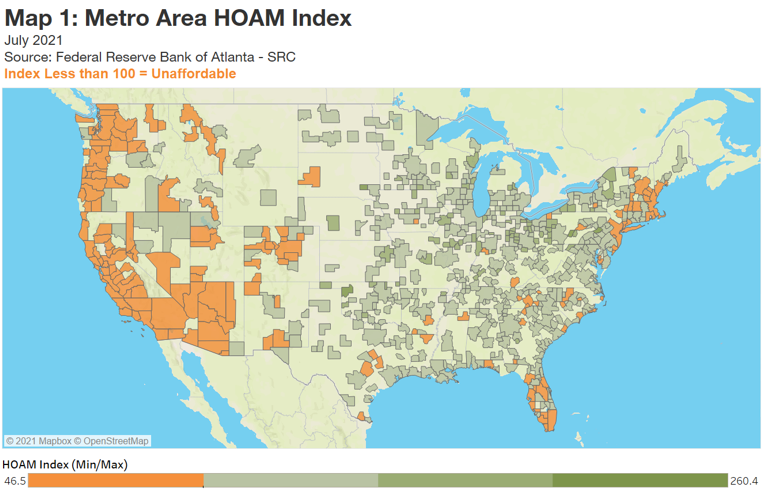
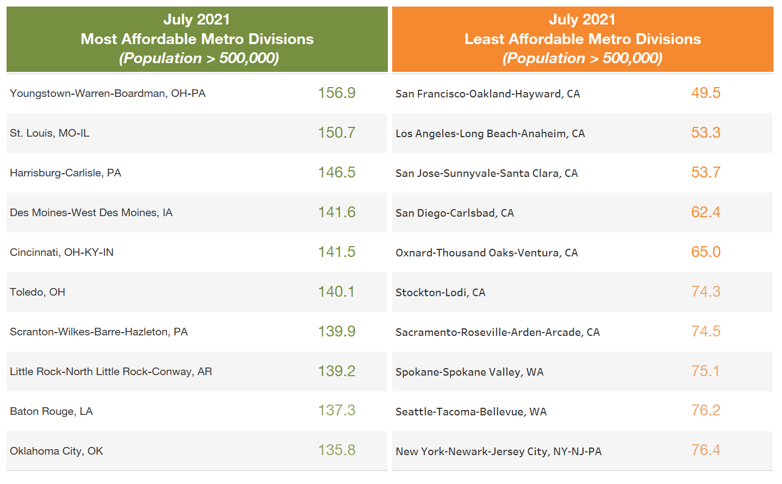
Although prices have risen across most US metropolitan areas, markets with more moderate price growth remain affordable. According to HOAM, Midwest metros tend to be among the most affordable in the country (see map 1). The Youngstown-Warren-Boardman area in northeast Ohio and western Pennsylvania remains the nation’s most affordable large metro. The median home sales price there was relatively low at $138,250 in July, and home price growth was flat over the past year. On average, owning a median-priced home in the market would consume 19.1 percent of the annual median household income ($49,287), the lowest cost of ownership among large US metros.
Alternatively, metros in California continue to be among the country’s least affordable. Historically, markets in northern California (San Francisco-Oakland-Hayward and San Jose-Sunnyvale-Santa Clara) and southern California (Los Angeles-Long Beach-Anaheim and San Diego-Carlsbad) have been some of the nation’s most expensive large metros. Though home price growth in these areas has not kept pace with national trends, rising prices have still eroded affordability.
In the area with banks supervised by the Atlanta Fed, which includes Florida, Georgia, Alabama, and parts of Mississippi, Louisiana, and Tennessee, home ownership affordability tends to be higher because of relatively low home prices in the Southeast compared with other US regions. High-cost markets in southern and central Florida remain an exception, however, as soaring home prices have made previously affordable markets too expensive for median-income households. In July, Tampa and Punta Gorda both fell below the HUD affordability threshold as the share of income needed to afford the median-priced home in those markets exceeded 30 percent.
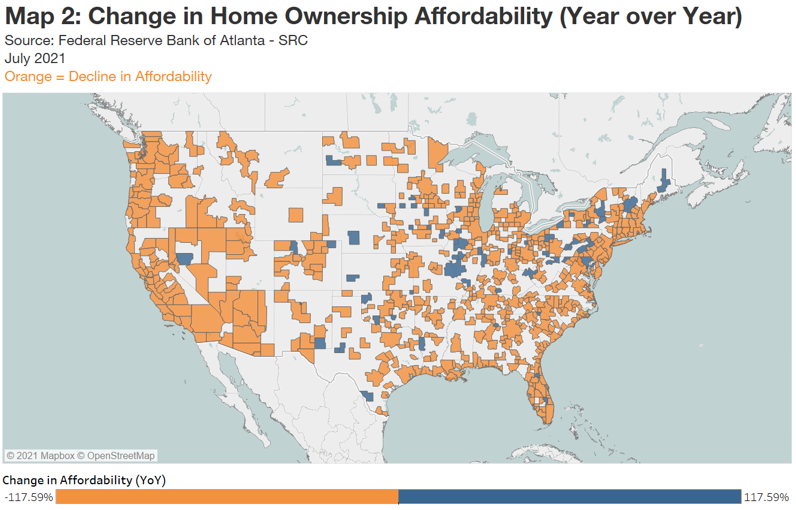
Over 80 percent of metro areas in the country saw a decline in affordability in the past year (see map 2). Among large metros, only St. Louis, Missouri; Harrisburg, Pennsylvania; Baltimore, Maryland; and Youngstown, Ohio, showed improvement in affordability in July from last year. For the most part, home sales price growth in these markets was not enough to offset the benefit from low interest rates and stronger wages.
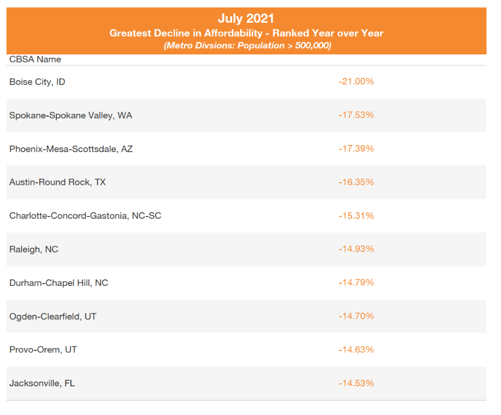
Markets that draw buyers from high-cost areas continue to post the sharpest contraction in affordability. For example, Boise City, Idaho; Spokane-Spokane Valley, Washington; Phoenix-Mesa-Scottsdale, Arizona; and Austin-Round Rock, Texas, tend to attract buyers from high-cost markets in California. The median price of homes sold in those four areas rose by over 25 percent in the past year, higher than the national increase (17.6 percent). Many of these relocating buyers sold homes in their previous markets and tend to have large sums of cash to apply toward a home purchase. Over the past year, the increase in remote-work arrangements gave consumers greater flexibility in terms of where they chose to live, making it easier to exit less-affordable, high-cost markets. In many cases, buyers moving out of higher-cost markets have been able to pay more for homes than many local residents in the markets where they moved, a factor that has priced many local buyers out of home purchases.
National housing market roundup
Here's a look at recent trends with important housing sector indicators:
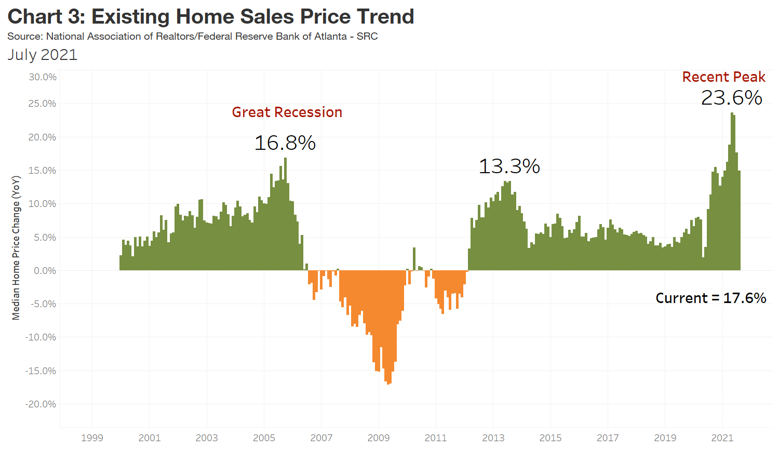
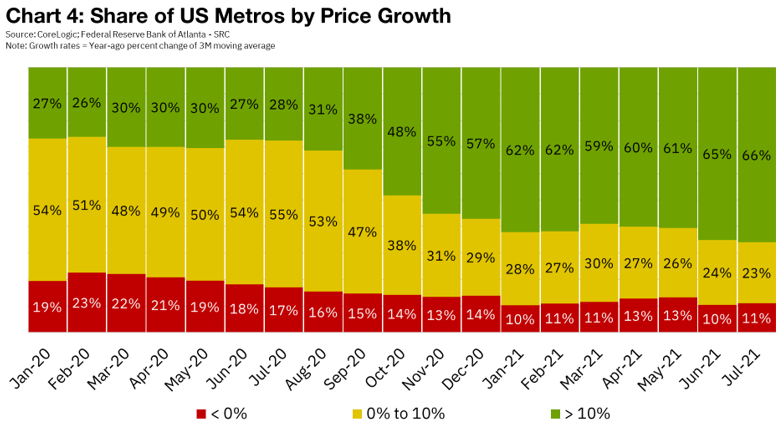
- Home Price Appreciation: Although home prices continue to rise, the rate of increase is lessening from the peak levels earlier this year (see chart 3). In July, home prices jumped 17.6 percent, down from May’s 23.6 percent rise. At the same time, the share of metro areas that have seen double-digit percentage rates of appreciation remain high at 66 percent (see chart 4).
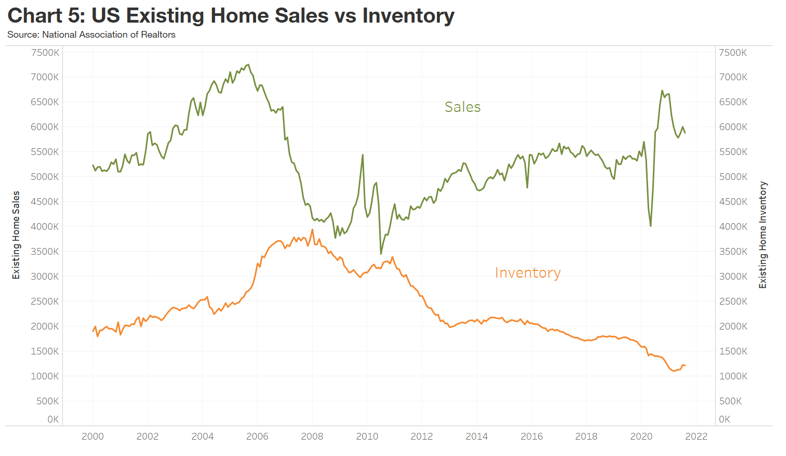
- Home Sales and Inventory: Demand for housing, while still strong by historic standards, is showing signs of easing, as existing home sales modestly dropped in August (down 2 percent) for the first time since April of last year, according to data from the National Association of Realtors. The more moderate level of housing demand may in part be due to concerns about affordability and buyer fatigue. At the same time, inventory levels look to be improving. Though inventories are still down by 14.7 percent from a year earlier, the rate of decline is moderating, an indication that supply and demand levels are becoming more aligned (see chart 5). Still, inventory remains low at a supply of 2.6 months and prices are expected to remain under steady upward pressure in the near future.
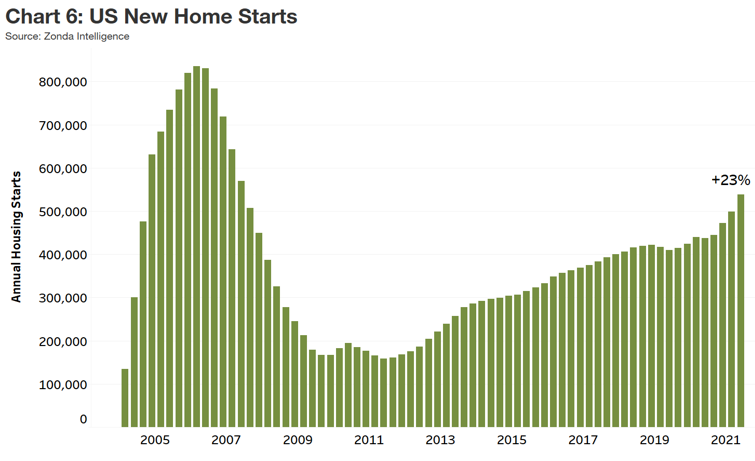
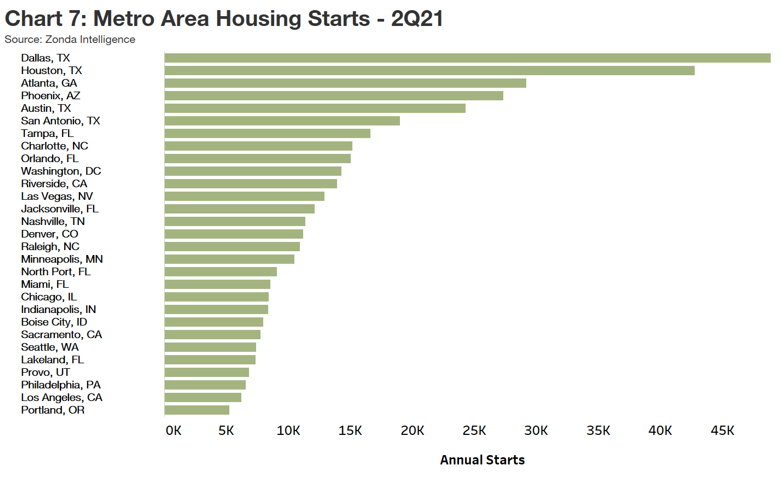
- Construction Activity: Impaired by capacity constraints through most of the pandemic, home construction has not kept pace with demand. Home builders continue to contend with rising costs and supply chain disruptions. Although the price of lumber has dropped from record highs earlier this year, costs for labor, land, and other materials continue to increase. After some builders slowed the pace of sales contracts earlier this year to better manage costs, many are now moving to resume more normal sales activity. Recently, builders have begun to accelerate the rate of new home starts, which rose by 23.1 percent in the second quarter from last year (see chart 6). Markets in Texas (such as Dallas and Houston) continue to lead the nation in new home construction activity (see chart 7). During the pandemic, low interest rates helped offset increases in new home prices, allowing builders to pass on rising costs to homebuyers. However, with affordability becoming more of a concern, some builders are seeing greater buyer resistance to price increases.
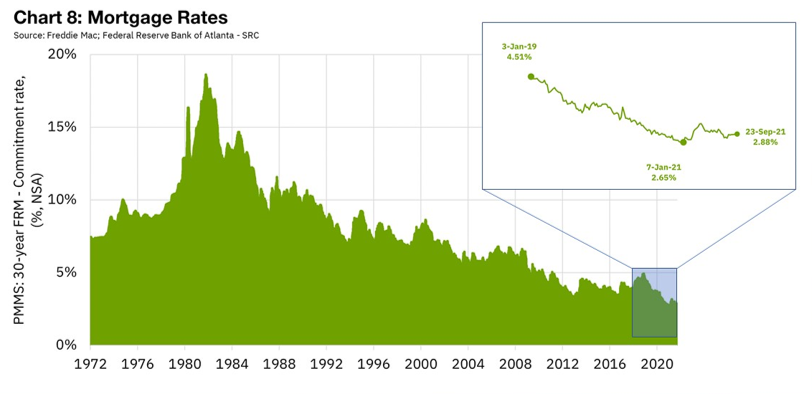
- Mortgage Rates and Underwriting: According to Freddie Mac, 30-year fixed mortgage rates stood at 2.88 percent on September 21, up from 2.65 percent in early January but still near historic lows (see chart 8). Even so, Fannie Mae’s Home Purchase Sentiment Index (HPSI) declined 3.9 percent in July as buyers expressed increased concern about higher home prices and the lack of properties for sale. In terms of underwriting, the recent Federal Reserve survey of senior loan officers found that, as a whole, banks reported easing standards on most mortgage types. Continued easing was noted on single family jumbo mortgages (those exceeding government-sponsored enterprise, or GSE, loan-servicing limits of $548,250 in all states except for areas designated as high-cost markets, where the limit is $822,375). The easing mostly reflects the removal of tighter lending policies put in place during the pandemic to bolster protections against default.
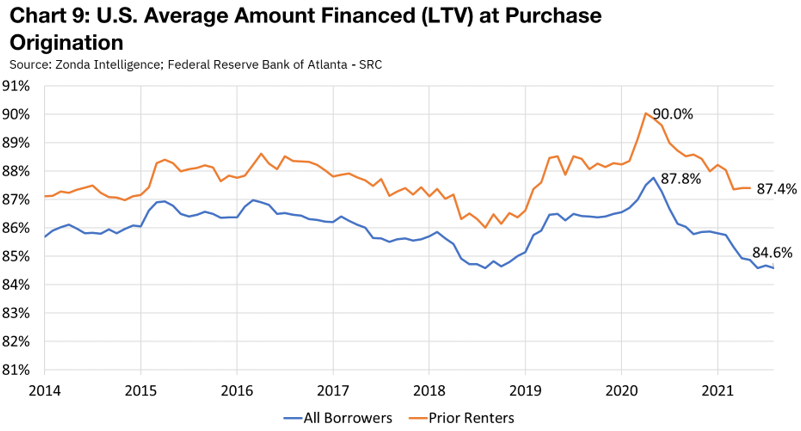
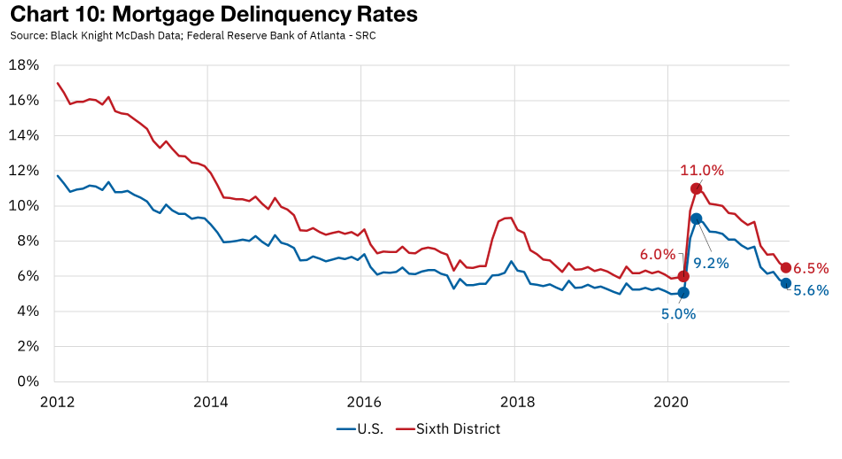
- Mortgage Credit Quality and Delinquencies: Throughout the pandemic, credit quality for new mortgages has remained strong. For example, after spiking in May 2020, the average loan-to-value ratio (LTV) for newly originated purchase mortgages has declined for borrowers who previously owned a home as well as prior renters, according to data provider Zonda Intelligence (see chart 9). As of August, the average LTV ratio for all borrowers dropped to 84.6 percent from a high of 87.8 percent in May 2020. For borrowers who were prior renters, the average LTV fell to 87.4 percent after peaking at 90 percent in May 2020. Lower LTV ratios partly reflect the large share of borrowers who have cash to contribute toward purchasing a home. They could also point to the absence of entry-level buyers with less purchasing power who have been priced out of the markets. Meanwhile, mortgage delinquencies continued to fall to pre-pandemic levels as more borrowers returned to remitting payments (see chart 10). Of all borrowers who were in forbearance during the pandemic, 46 percent have resumed making payments, while 21 percent have paid off their mortgages, according to data provided by Black Knight. Still, it is estimated that 1.6 million borrowers who are currently delinquent are not in a loss-mitigation program. With many forbearance programs and accommodations set to lapse by the end of the year, servicers will have to be prepared to transition borrowers to mortgage restructuring programs or foreclosure.
For more details, including metro-level analysis, please visit the interactive Home Ownership Affordability Monitor.

Domonic Purviance
a residential real estate subject matter expert in the Real Estate Intelligence Team/Risk Analysis Unit of the Atlanta Fed's Supervision, Regulation, and Credit Division