

Key points
- National home ownership affordability fell 11.5 percent in August year over year, the sharpest decline since 2013.
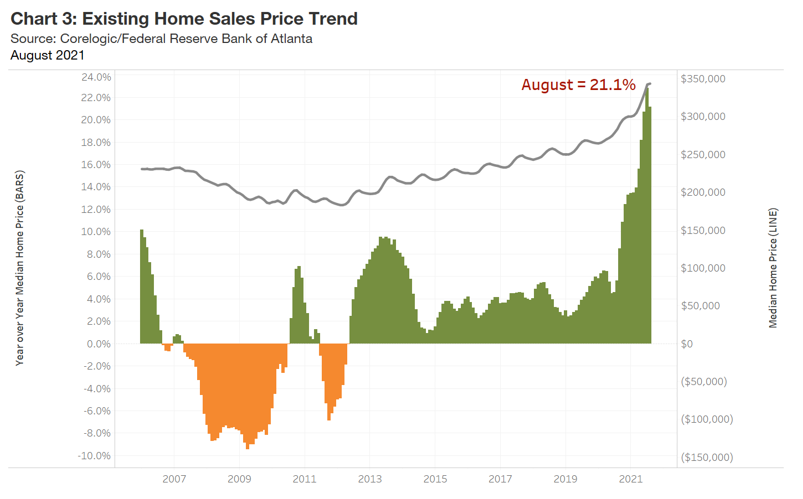
- Home price appreciation moderated slightly in August but was still up 21.1 percent over the past year.
- A median-income household would need to spend 32.4 percent of its earnings to own a median-priced US home, the highest cost of ownership since 2008.
- Homebuyers are increasingly concerned about the decline in affordability and fewer believe it is a good time to buy.
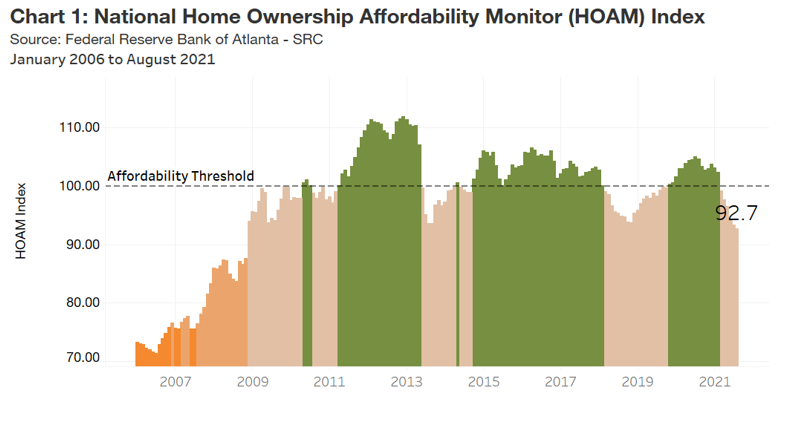
National affordability: Affordability declines by 11.5 percent
Home ownership affordability continued to decline in August, according to the Federal Reserve Bank of Atlanta’s Home Ownership Affordability Monitor (HOAM) index. In August, the HOAM index dropped to 92.7, down 11.5 percent from August 2020 (see chart 1). Since March 2021, the HOAM index has remained below 100, which means a median-priced home on the market is unaffordable for a median-income US household. The median home price in August rose to $343,472 (3-month average), according to CoreLogic. This was up 21.1 percent over August 2020. Given current home prices, a median-income household would need to spend 32.4 percent of its annual income to own a median-priced home. This is above the 30 percent affordability threshold set by the US Department of Housing and Urban Development (HUD). The current share of income needed to afford a median-priced home remains at levels not seen since the last housing downturn in 2008.
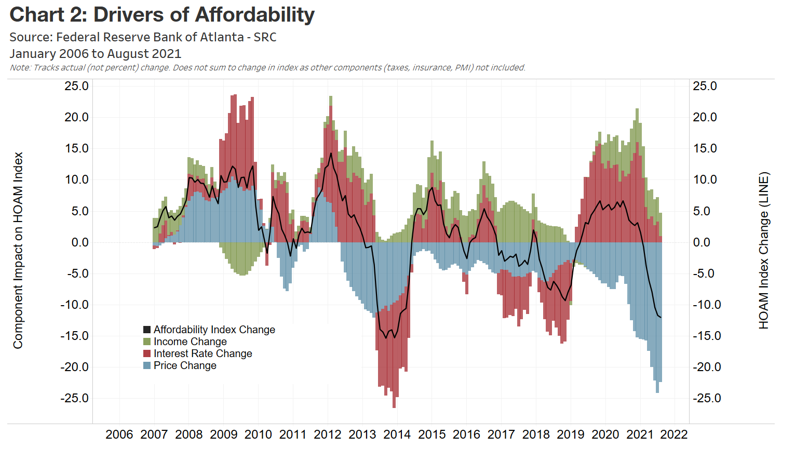
Although 30-year fixed mortgage interest rates have risen slightly, they remain near historic lows and remain a positive driver of affordability. Steady wage growth as the economy emerges from the COVID-19 pandemic-related slowdown has also added to the purchasing power of households considering buying a home. However, the benefits created by both low interest rates and higher wage growth for home ownership affordability have declined over the past few months (see chart 2). Perhaps more importantly, a sharp rise in home prices has offset whatever benefit potential homebuyers could have gained from lower rates and higher wages.
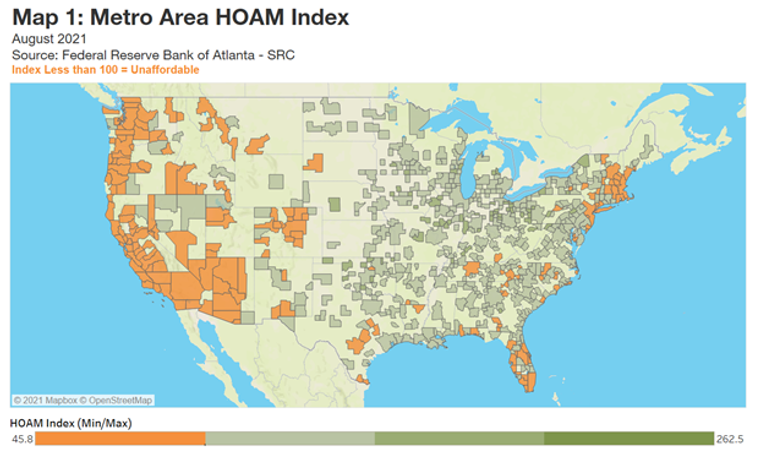
Regional affordability: Decline in affordability is widespread across most regions
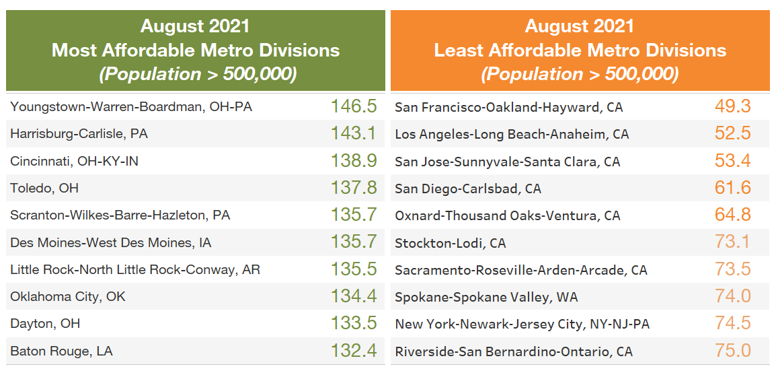
Metro areas in the Midwest remain amongst the most affordable in the country (see map 1). The Youngstown-Warren-Boardman area in northeast Ohio and western Pennsylvania was the nation’s most affordable large metro in August, with a relatively low median home sales price at $150,750. On average, owning a median-priced home in the market would consume 20.8 percent of the area’s annual median household income ($49,331). Though remaining the most affordable large metro in the country, affordability in Youngstown declined by 5.9 percent over the past year as home prices in the area rose by 10.1 percent.
Metros in California continue to be among the country’s least affordable. With a median home price of $1.3 million in August, San Francisco-Oakland-Hayward remained the most expensive and least affordable large metro area. Although the median household income is well above the national average ($118,122 in August), owning a home currently on the market would be out of reach for a median-income household in San Francisco. Other California markets, such as Los Angeles-Long Beach-Anaheim, San Jose-Sunnyvale-Santa Clara, San Diego-Carlsbad, and Oxnard-Thousand Oaks-Ventura, round out the nation’s top 5 least affordable metro areas. In almost all of these regions, housing affordability declined over the past year despite already being at historic lows.
Being relatively less expensive when compared to other regions, metros within the Atlanta Fed’s District, which includes Florida, Georgia, Alabama, and parts of Mississippi, Louisiana, and Tennessee, tend to have higher home ownership affordability. High-cost markets in southern and central Florida remain an exception, however, as soaring home prices have made previously affordable markets too expensive for median-income households in those areas.
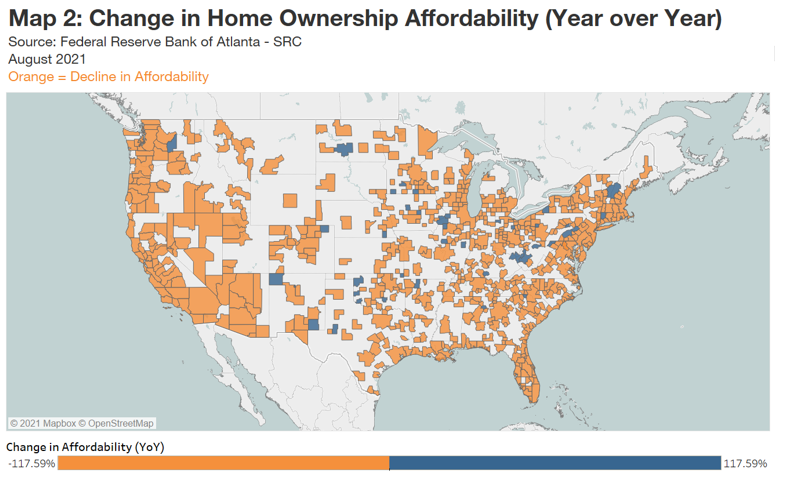
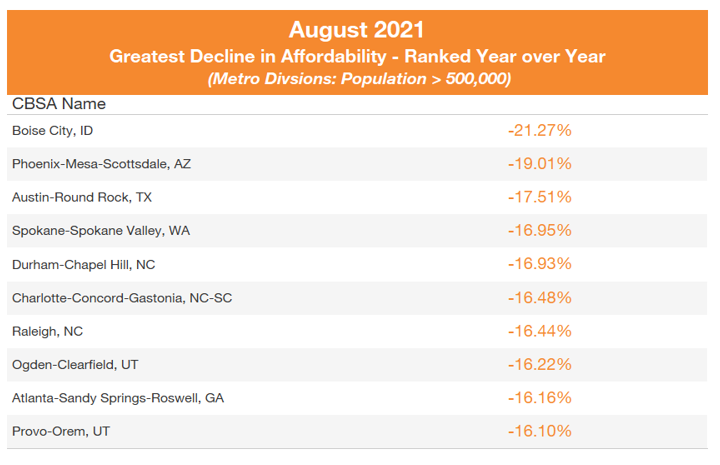
Although most metros in the nation remained below the HUD affordability threshold, more than 80 percent of metro areas experienced a decline in affordability over the past year (see map 2). Boise City, Idaho, down 21.3 percent, continued to lead the nation with the sharpest decline. Although the rate of price growth moderated in August, median home prices in Boise City reached a new high of $449,438, up from $336,357 a year ago. Similar to other markets like Phoenix and Austin, an increase in remote-work arrangements and high levels of home equity continued to give homeowners in high-costs markets like California increased incentives to sell and move to relatively cheaper markets like Boise City. In many cases, buyers moving out of higher-cost markets have been able to pay more for homes than many local residents in the markets where they moved and have priced many local buyers out of home purchases.
Within the Atlanta Fed’s District, the Atlanta Metro area experienced the sharpest decline in affordability over the past year, falling 16.2 percent. Although remaining below the HUD affordability threshold with a 28 percent share of income needed to afford a median-priced home, affordability in Atlanta declined over the past year as home prices increased 25.9 percent. Home prices remained under upward pressure in Atlanta and in other regions in the Southeast due to a combination of inventory shortages, an influx of buyers from high costs markets, and a surge in investor activity.
National housing market roundup
Here's a look at recent trends with important housing sector indicators:
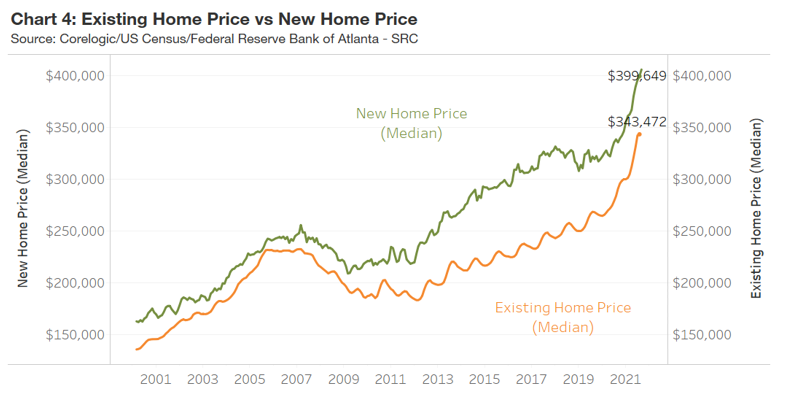
- Home Price Appreciation: The rate of home price growth remained near record levels in August, up 21.1 percent (see chart 3). Both existing and new home prices continued to break records, with median existing home prices now above $340,000 and median new home prices peaking at just under $400,000 (see chart 4). Shortages in existing home supply, supply chain disruptions, and higher labor and material costs combined to push prices higher. However, there are signs that upward pressure on home prices is moderating. For example, the average sales-to-list price in the nation, which had risen above 100 during the pandemic, steadily declined to below 100 over the past few months, according to Redfin. In addition, home builders who previously were able to pass on rising costs to consumers throughout the pandemic recently indicated that it has become harder to do so as buyers are becoming increasingly resistant to higher home prices.
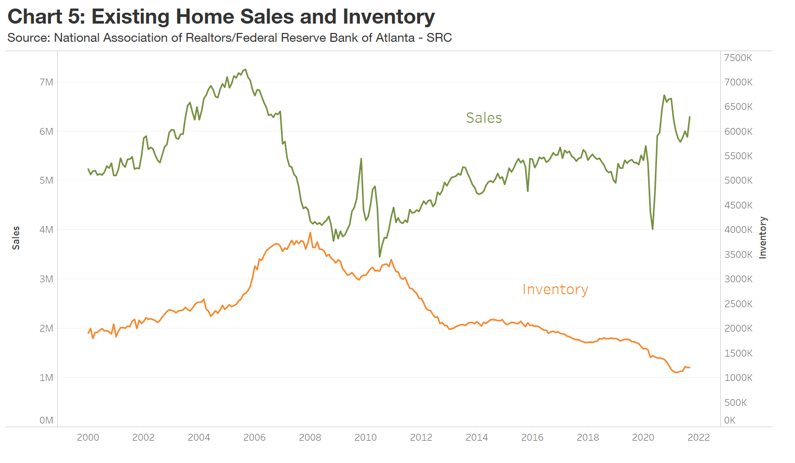
- Home Sales and Inventory: Demand for housing, while still strong by historical standards, is showing signs of easing. According to the National Realtors Association, existing home sales dropped by 2.3 percent in September from the prior year, which is the second straight month of decline. At the same time, existing home inventory dropped by 13 percent over the past year (see chart 5), and the months supply of inventory stood at a very low 2.3 months, well below the 4-to-6 months supply that is considered balanced. Though supply shortages remain part of the reason for softer sales, there is growing evidence that housing demand may be impacted by increasing concerns about affordability. According to the Fannie Mae Home Purchase Sentiment Index (HPSI) in October, only 30 percent of home buyers surveyed said that it was a good time to buy, while 77 percent believed it was a better time to sell. Though up from the previous month, the share of consumers who believed it was a good time to buy was still near historic lows.
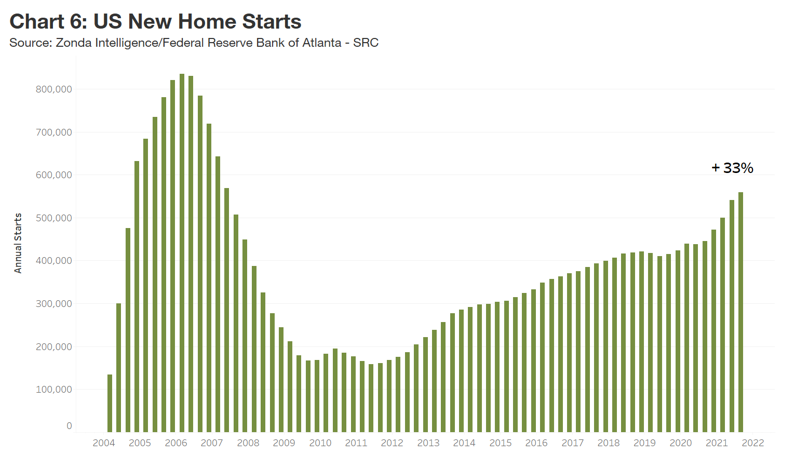
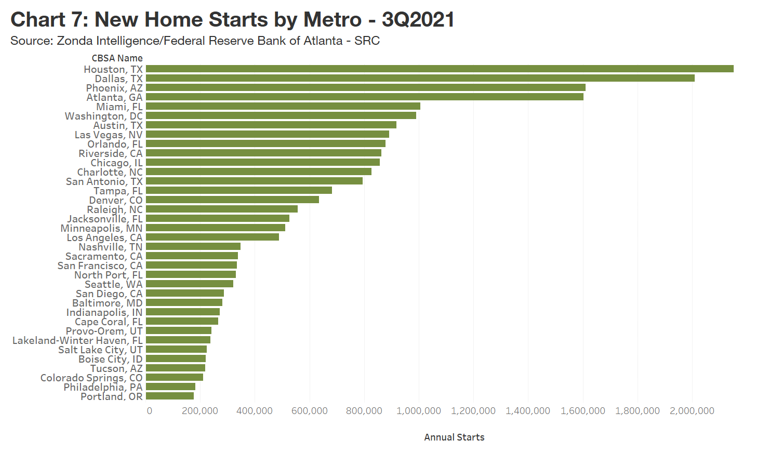
- Construction Activity: Despite continued supply chain disruptions, new home construction accelerated through the third quarter of 2021 as builders sought to keep pace with demand. Over the past year ending in September, new home starts increased by 33 percent (see chart 6) and markets in Texas, such as Houston and Dallas, continue to lead the nation in new home construction activity (see chart 7). Still, bottlenecks in the supply chain and upward pressure on labor and material costs are expected to continue to challenge homebuilders.
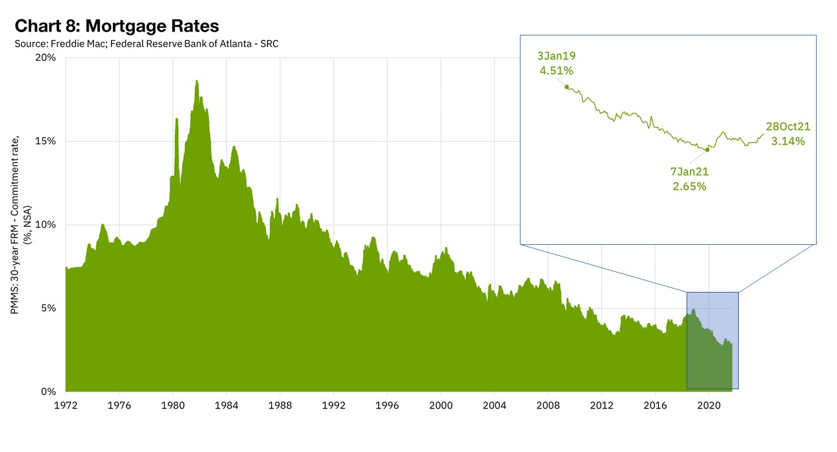
- Mortgage Rates and Underwriting: At the end of August, the 30-year fixed mortgage rate stood at 2.9 percent, according to Freddie Mac. Since then, interest rates have slowly risen, ending October at 3.1 percent (see chart 8). Although remaining near historic lows, the marginal increase in mortgage rates is likely to lead to further declines in affordability. In the meantime, according to the most recent Federal Reserve's Senior Loan Officer Survey, banks reported stronger demand for most types of residential real estate loans during the second quarter. Except for government-sponsored enterprise (GSE)-eligible mortgages and subprime mortgages, banks also reported continual easing of residential mortgage underwriting standards. This is especially true for jumbo mortgages (those exceeding GSE loan-servicing limits of $548,250 in all states except for areas designated as high-cost markets, where the limit is $822,375). Demand for jumbo mortgages has seen the strongest increase of all residential loan categories. The easing of underwriting standards mostly reflects the removal of tighter lending policies put in place during the pandemic to bolster protections against default.
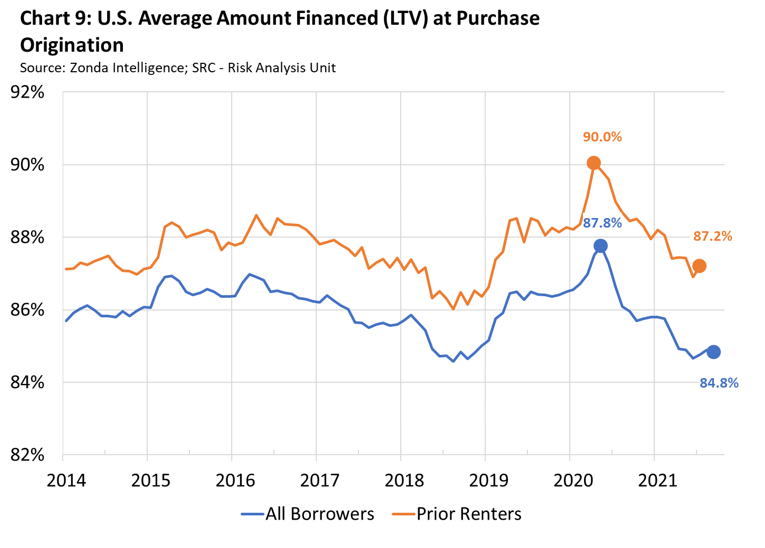
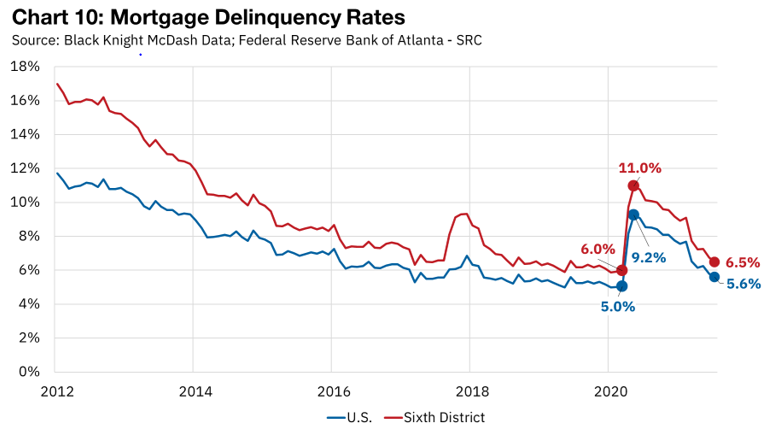
- Mortgage Credit Quality and Delinquencies: As of September, the average loan-to value (LTV) ratio for all borrowers dropped to 84.8 from a high of 87.8 in May 2020 (see chart 9). For borrowers who were prior renters, the average LTV ratio fell to 87.2 in the most recent figures after peaking at 90 in May 2020. Lower LTV ratios partly reflect the large share of borrowers who have cash to contribute toward purchasing a home. They could also point to the absence of entry-level buyers with less purchasing power who have been priced out of markets. Meanwhile, mortgage forbearances and delinquencies in July fell to pre-pandemic levels as more borrowers returned to remitting payments (see chart 10). Of all borrowers who were in forbearance during the pandemic, 46 percent have resumed making payments, while 21 percent have paid off their mortgages, according to data provided by Black Knight. Still, a significant amount of currently delinquent borrowers are not in a loss mitigation program. With many forbearance programs and accommodations set to lapse by the end of the year, servicers will have to be prepared to transition a potential uptick of delinquent borrowers to mortgage restructuring programs or foreclosure.
For more details, including metro-level analysis, please visit the interactive Home Ownership Affordability Monitor.

Domonic Purviance
a residential real estate subject matter expert in the Real Estate Intelligence Team/Risk Analysis Unit of the Atlanta Fed's Supervision, Regulation, and Credit Division