
Key points
- Higher home prices and higher interest rates have led to record declines in home ownership affordability.
- The Atlanta Fed’s HOAM Index dropped in April to 72.8, its lowest level since July 2006.
- Home ownership affordability declined by 25.2 percent in April compared to one year earlier, the sharpest decline on record, going back to 2006.
- A median-income household would need to spend 41.2 percent of its income to own a median-priced house, the highest share since August 2006.
- A household would need to pay $639 more per month to own a median-priced home in April compared to a year ago, the largest increase on record.
Rapid deterioration in home ownership affordability is having a significant impact on housing demand in the Sixth District and throughout the nation. As more households are priced out of the market, many are concluding that now is not a good time to buy.
National affordability: Affordability declines by record level
According to the Federal Reserve Bank of Atlanta’s Home Ownership Affordability Monitor (HOAM), affordability declined by 25.2 percent in April 2022 compared to a year earlier. This is the largest decline on record, going back to 2006. According to HOAM, the threshold for affordability is an index of 100. When the index drops below 100, it means that a median-income household cannot afford a median-priced home. Since February 2021, affordability has been below the 100 threshold nationally. In April, the index dropped to 72.8 (see chart 1), its lowest since July 2006.
Chart 1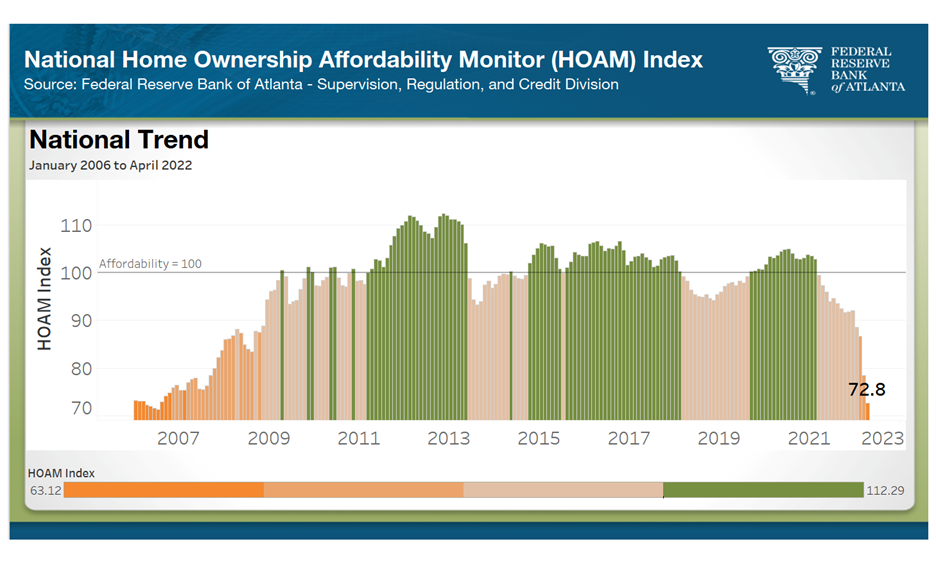
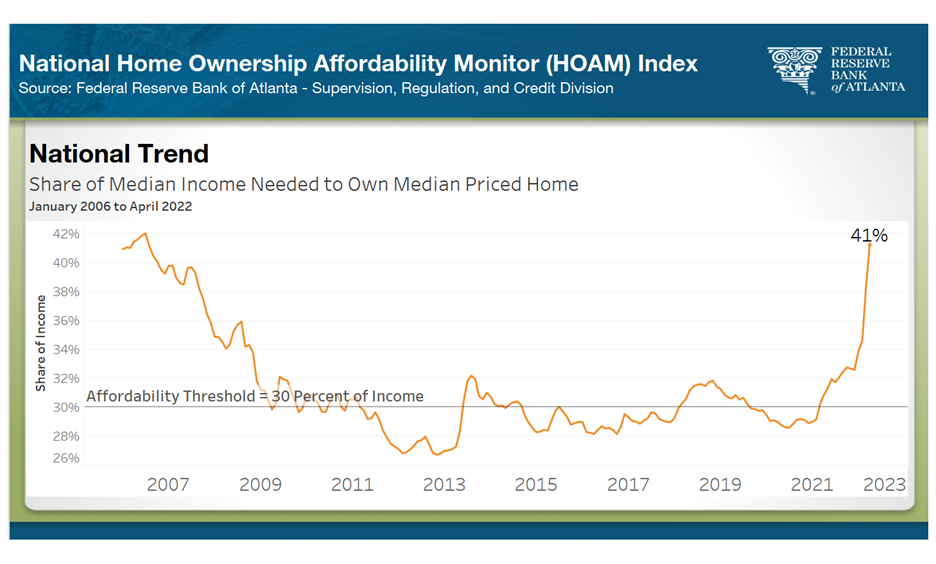
According to HOAM, owning a home is considered affordable if the annual cost of ownership (that is, the total principal, interest, taxes, and insurance payments) does not exceed 30 percent of household income. In April, a median-income household needed to spend 41.2 percent of its annual income to own a median-priced home, up from 31 percent in April 2021 (see chart 2). This is the highest this measure has been since August 2006. To put this in perspective, the average household would spend around $639 more per month to own a median-priced home compared to a year ago. This is the sharpest year-over-year change on record.
Chart 2
Primary causes of the decline in affordability have been rapid price appreciation and the rise in interest rates since the beginning of the year (see chart 3).
Chart 3
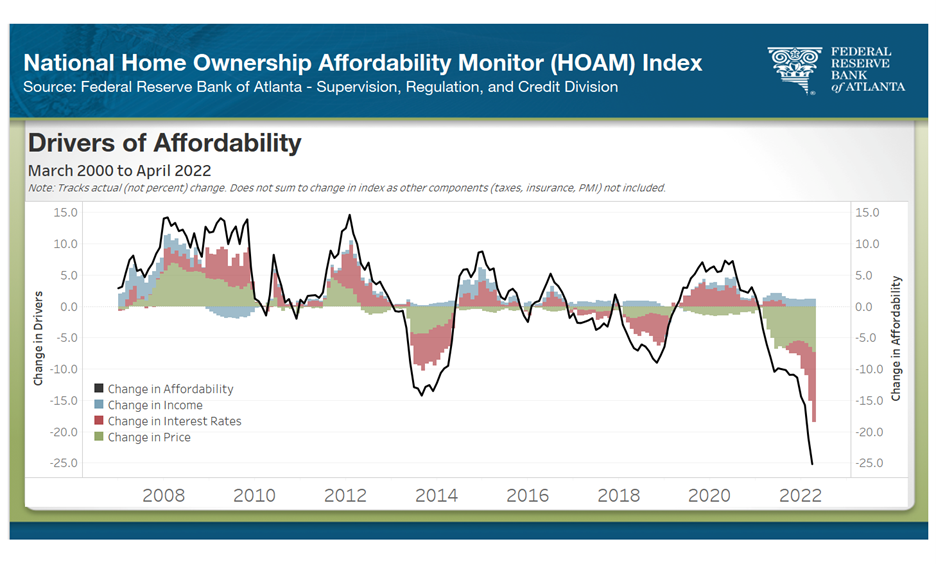
- Home prices: After slowing through the beginning of 2022, the rate of price appreciation has accelerated over the past few months. The national median home price in April was up by 17 percent compared to one year earlier. Meanwhile, the median home price reached $368,667 (three-month average) and the median total monthly payment (including principal, interest, taxes, and insurance) rose to $2,350 per month. Both are record levels. In comparison, the median price in January 2020, prior to the pandemic, was $264,000, more than $100,000 less than it is now.
- Interest rates: By far, the most significant factor affecting affordability is the sharp rise in interest rates. In April, the 30-year fixed mortgage rate was 5.1 percent. This is around 200 basis points higher than in April 2021, and 150 basis points higher than in January 2022. It should be noted that mortgage rates had risen to nearly 6 percent by late June. As a result, HOAM calculations over the next few months are expected to show continued deterioration in affordability as higher rates are factored into the calculation. (Note: The HOAM index of affordability is calculated based on the availability of home sales price data, which is normally delayed by a few months.)
- Income: Although wages have risen as the effects of the pandemic have waned, inflation has blunted much of the benefit to household purchasing power. This is especially true for those in the middle to lower tiers of wage earners. (See the Atlanta Fed’s Wage Growth Tracker by Wage Level for more detail.) In terms of home ownership affordability, any increase in income growth experienced by households has been more than offset by the effects of rising home prices and the recent sharp increase in interest rates.
Regional affordability: Decline in affordability is widespread across most regions
Midwest markets remained among the most affordable in the country (see chart 4). In April, St. Louis ranked as the nation’s most affordable large market (defined as an area with a population of 500,000 and above). A household earning the median income in the market ($67,916) would pay 24.5 percent of its annual income to own a median-priced home ($204,217). The total monthly payment for a median-priced home in St. Louis was around $1,385 per month.
Chart 4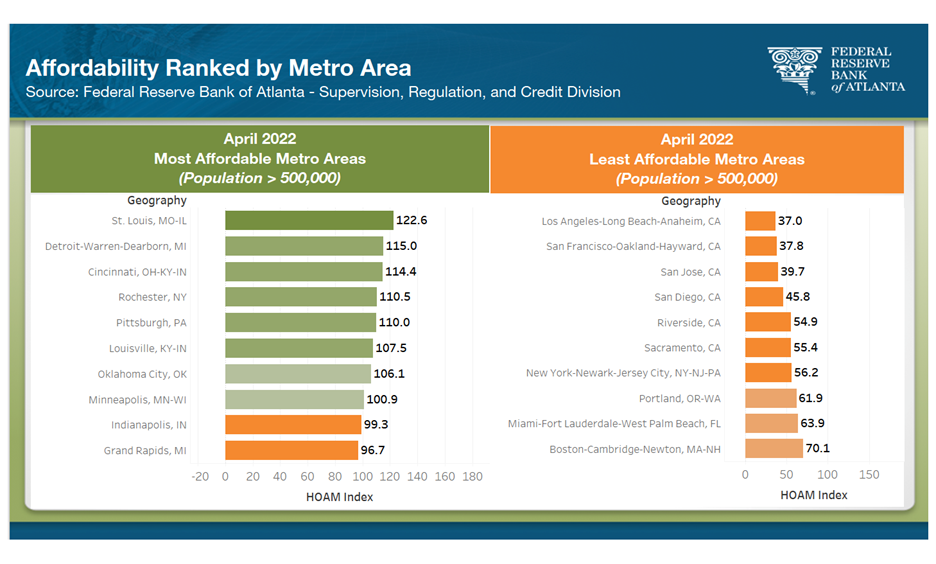
At the opposite end of the spectrum, California is home to the six least affordable markets. Los Angeles-Long Beach-Anaheim ranked as the least affordable among them with a median home price of $927,523. The total monthly payment was $5,440 in April, an increase of more than $1,600 from a year earlier. For a household earning the median income in the Los Angeles metro area ($80,403), owning a median-priced home would be significantly out of reach.
The decline in affordability has been widespread (see chart 5). At -35 percent, Phoenix and Nashville tied for the sharpest percentage decline in affordability over the past year, much worse than the 25.2 percent decline nationally. Home prices in Phoenix and Nashville rose more than 28 percent year over year, the sharpest rise in the nation.
Chart 5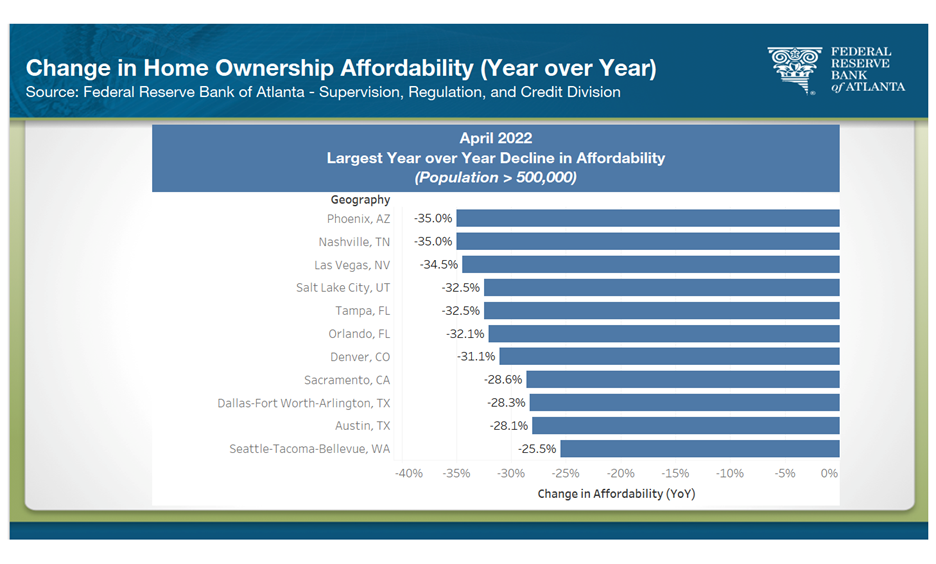
National housing market roundup
Here's a look at recent trends among important housing sector indicators:
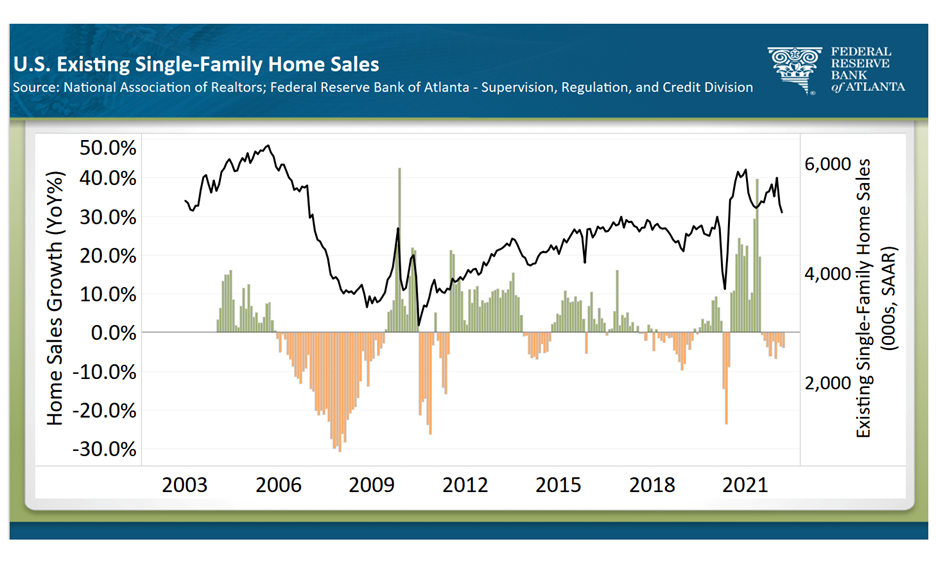
- Home sales: According to the National Association of Realtors (NAR), existing home sales in May were down by 8.6 percent from one year earlier (see chart 6). Similarly, pending home sales, a more forward-looking measure, dropped by 9.1 percent from a year ago, according to the NAR. Redfin, a national real estate brokerage, showed a similar decline in May for sales and pending sales, down 10.2 and 9.2 percent, respectively. Moving forward, market activity likely will continue to weaken, as evidenced by recent drops buyer sentiment and mortgage origination activity. The Fannie Mae Home Purchase Sentiment Index for May showed that a record high 79 percent of potential buyers think it is a bad time to buy a home. The major concern for potential buyers, according to the survey, was the decline in affordability. The decline in home buying sentiment is beginning to manifest in sales activity. According to the Mortgage Bankers Association, purchase mortgage applications declined by 9.4 percent for the week ending June 17 compared to one year earlier, while refinance applications dropped by 77.1 percent for the same period. All of this reflects the drag that declining affordability has had on buyer sentiment and home sales since the beginning of the year.
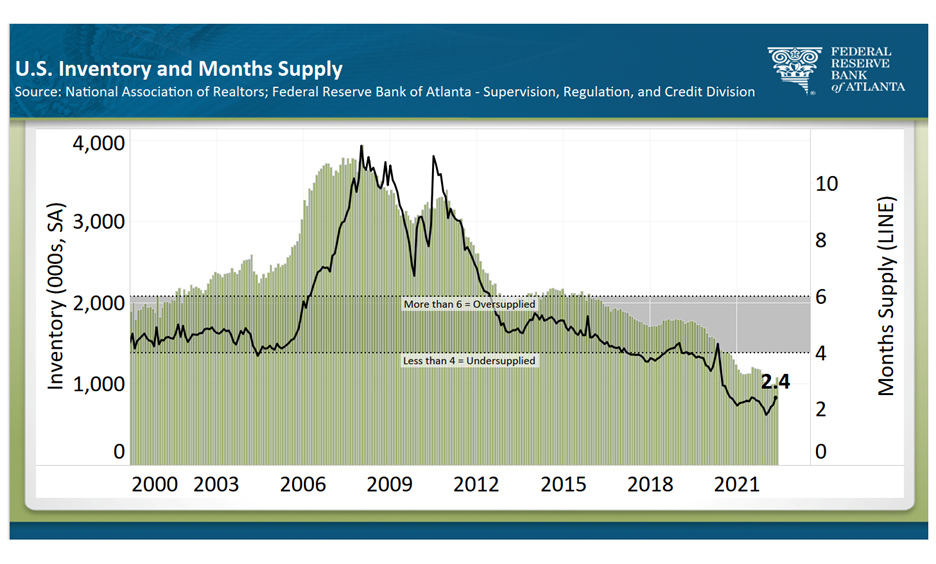
- Inventory: Although the decline in affordability is primarily to blame for lackluster buyer sentiment and housing demand, a continued inventory shortage is also a factor (see chart 7). According to NAR, existing home inventory—which includes single-family, condo, and co-ops—though rising on a month-over-month basis, still was down 4.1 percent year over year in May. After falling below two months over the past year, the current months’ supply of inventory is 2.4 months. The contraction in demand expected in the coming months is likely to lead to a further increase in inventory. A rise in the days-on-market and a decline in the sales-to-list price ratio would be a further downward shift in market conditions. Still, the current months’ supply is below the four-to-six months’ level considered to be balanced, and many markets throughout the Sixth District are still experiencing significant supply shortages. The months’ supply would have to rise above six months (which is considered oversupplied) before prices experience downward pressure. Furthermore, the lock-in effect – that is, homeowners who refinanced their homes over the past two years are locked in at historically low rates - has created a disincentive for many homeowners to list their homes on the market and may be contributing to the lack of supply. As a result, despite weaker demand, the number of days a home remained on the market stood near record lows, and homes on average sold for 3.1 percent above the asking price in May, according to data from Redfin.
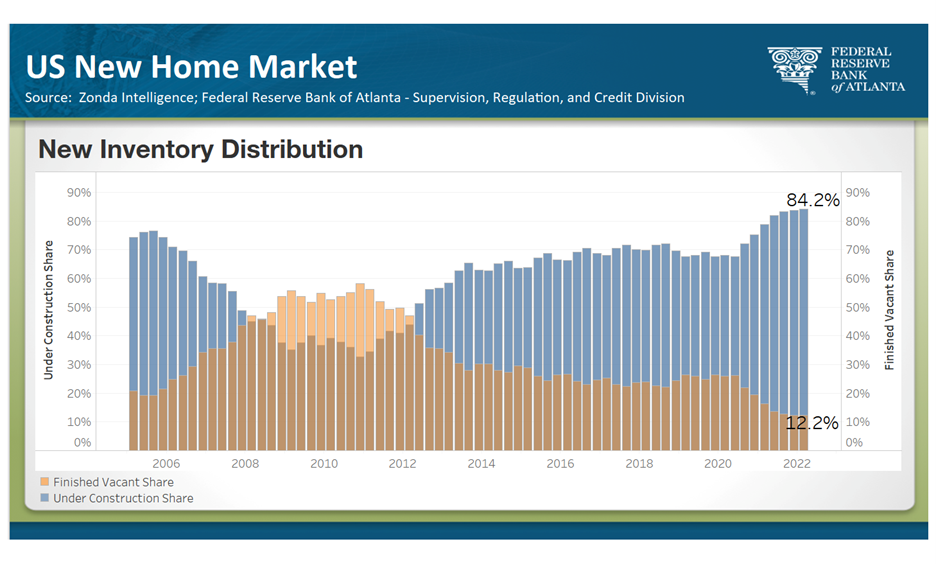
- Construction activity: Although supply chain disruptions and labor shortages continue to weigh on the new-home market, construction levels have risen. According to data from Zonda Intelligence, annual new home starts rose by 9.3 percent during the first quarter of 2022 compared with the first quarter of 2021. This is down from 26 percent and 17 percent year-over-year increases in annual starts in the third quarter of 2021 and the fourth quarter of 2021, respectively. At the end of the first quarter of 2022, the share of new-home inventory under construction was 84.2 percent, compared to only 12.2 percent finished vacant or unsold (see chart 8). Much of the inventory under construction during the first quarter of 2022 will be delivered during the second and third quarters of 2022. In recent months, builders have reported that although markets in the Southeast—including Nashville, Tampa, and Orlando—remain strong, higher rates and a surge in prices are affecting buyers’ ability and willingness to purchase a new home. This is especially true for first-time or entry-level buyers. Cancellations have been on the rise and more builders expect to increase incentives to secure sales.
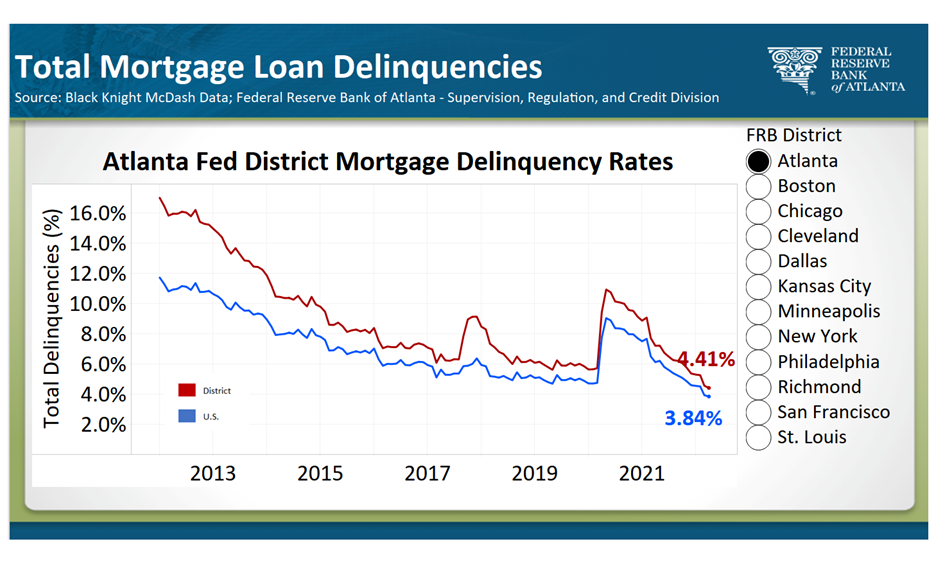
- Underwriting and credit quality: According to the most recent Federal Reserve’s Senior Loan Officer Opinion Survey, banks reported easing of underwriting standards in most residential real estate (RRE) categories. Overall, demand for most RRE loan types was weaker, with home equity lines of credit the lone exception. For the most part, credit quality remains strong with higher FICO scores and high loan-to-values dominating originations. Although higher when compared to the rest of the nation, mortgage delinquencies in the Sixth District continue to decline, following the national trend (see chart 9).
For more details, including metro-level analysis, please visit the interactive Home Ownership Affordability Monitor.

Domonic Purviance
a residential real estate subject matter expert in the Real Estate Intelligence Team/Risk Analysis Unit of the Atlanta Fed's Supervision, Regulation, and Credit Division