

Unemployment rates jumped from March to April across the country, including in the Southeast. The U.S. Bureau of Labor Statistics' State Employment and Unemployment Summary for April illustrates some of the varying effects of the COVID-19 pandemic on labor markets across Sixth District states. Mississippi's rate was highest, at 15.4 percent, while Tennessee experienced the sharpest increase, up 11.4 percentage points. Georgia had both the lowest rate in April for the region, 11.9 percent, and the smallest increase, up 7.3 percentage points from March.
The jump in unemployment rates occurred despite a decline in the size of the region's labor force. In Alabama, the rate of participation in the labor force shrank by almost 1 percent from March to April, and participation dropped 5.3 and 5.2 percentage points in Louisiana and Florida, respectively, compared to a 2.5 percentage point drop nationally.
These outsized changes in unemployment and labor market participation were undoubtedly a consequence of the steep decline in employment across the region. The proportionate change in employment from March to April varied from a 12.2 percent decline (in Louisiana) to a 10.1 percent decline in both Alabama and Mississippi (see the charts).
In recent weeks, southeastern states have begun the process of reopening their economies, but how that process will unfold for local labor markets is shrouded in uncertainty, and the risk of a second wave of COVID-19 infections hovers over the reopenings, as Atlanta Fed president Raphael Bostic recently noted in a CNBC interview.
The Atlanta Fed's Jobs Calculator shows how various labor market scenarios might play out. With the April update made on May 22, we introduced a refreshed state-level Jobs Calculator to perform these calculations.
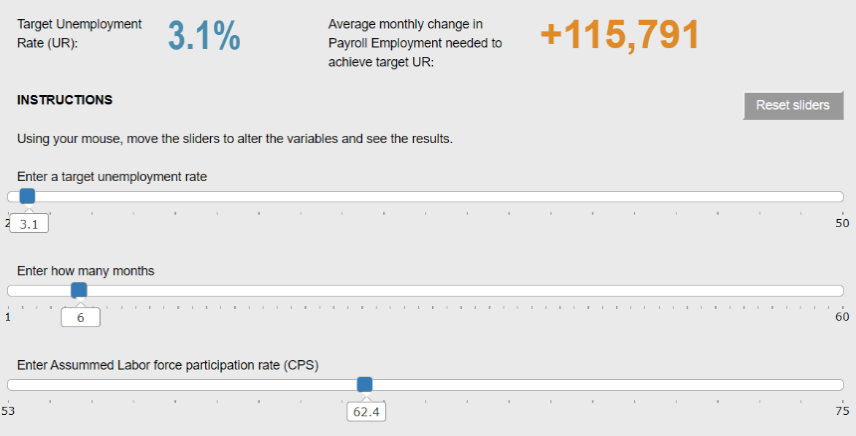
Using Georgia as an example, the state was among the first to relax restrictions on economic activity. What employment implications could this relaxation have? At one extreme, we could see residents and businesses move quickly off the sidelines. Suppose that in six months, the labor force participation rate rose back to the February rate of 62.4 percent and the unemployment rate was back down to 3.1 percent. To achieve these targets, how many jobs would need to be added over the next six months? Using the state-level Jobs Calculator, we find that an average of 115,791 jobs would need to be added each month over this period—or nearly 20 times the average monthly job creation in Georgia during 2019! Of course, a return to pre-pandemic labor market conditions could take much longer. If Georgia were to add just twice as many jobs per month than it averaged during 2019 (and labor force participation stayed at its current historically low level), it would take nearly five years to return to a 3.1 percent unemployment rate.
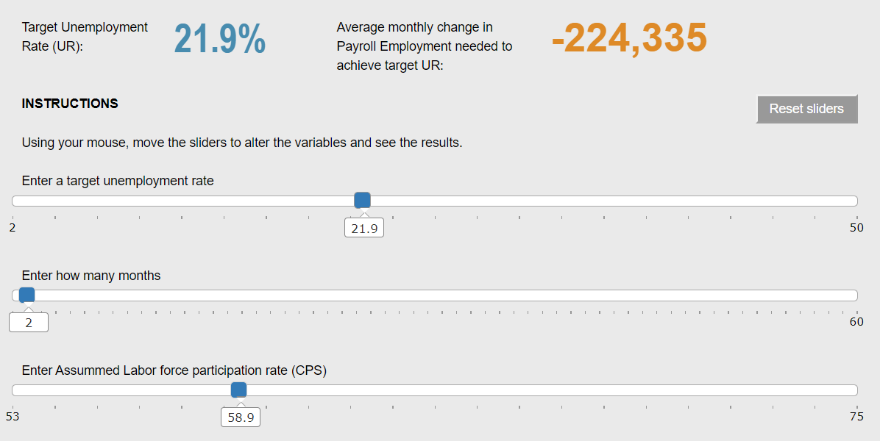
In another scenario, suppose the reopening of Georgia's economy is not uneventful, and an increase in COVID infections leads to a second state-mandated shutdown and results in payrolls jobs shrinking by an additional 13 percent over the next two months, or about 224,000 jobs for each of May and June (see the chart). If labor force participation remains at April's rate, this additional job loss would push Georgia's unemployment rate up to 21.9 percent.
We invite you to try out your own hypothetical state-level scenarios. Our calculator includes data for all 50 states and the District of Columbia.

Whitney Strifler
An economic policy analysis expert in the Atlanta Fed's Research Department