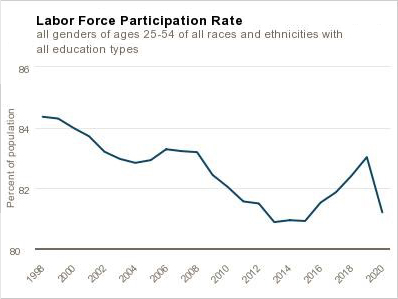
We recently updated our Labor Force Participation (LFP) Dynamics tool with 2020 data. The new data highlight the impact that the COVID-19 pandemic had on the U.S. labor force in 2020. For example, the fraction of the adult population aged 25–54 employed or looking for work dropped from 83.0 percent to 81.2 percent between the fourth quarters of 2019 and 2020 (see the chart).
The 1.8 percentage point drop is mostly accounted for by a 1.1 percentage point rise in the share of people saying they want a job but are not actively looking (a segment often called the shadow labor force), combined with a 0.5 percentage point rise in the share of adults saying they had family responsibilities that kept them from looking for work, and a 0.3 percentage point rise in reasons not otherwise specified (but most likely attributable to concerns about COVID-19). Only partly offsetting these increases in nonparticipation was a 0.1 percentage point drop stemming from being in school or training, which could also be a result of COVID-19.
The Labor Force Dynamics tool allows users to dig into different demographic groups to investigate COVID-19's disparate impact on labor market engagement. For instance, for Black non-Hispanics aged 25–54, the decline in LFP is almost 3 percentage points: much larger than the overall decline. Over two-thirds of the decline for prime-age Blacks is attributed to a rise in the share of Black adults who want a job but are not currently searching for work. For Hispanic women, the participation decline is just over 2 percentage points, with half of that decline attributable to increased family responsibilities, which could be due to the lack of childcare options.
I encourage you to check out the updated LFP Dynamics tool. One interesting comparison would be to contrast what has happened over the last year with what happened to LFP and the reasons for nonparticipation between the fourth quarters of 2007 and 2010 (during the Great Recession). You will find some common features, but also some important differences. Enjoy!

By
John Robertson, a senior policy adviser in the Atlanta Fed's Research Department