The US Bureau of Labor Statistics' (BLS) labor report for January 2022 showed that the overall labor force participation (LFP) rate increased 0.3 percentage points from December's published level. This increase put the LFP rate at its highest level since the pandemic began and, taken at face value, might make you think that the labor supply problems that have plagued the recovery from the COVID-19 pandemic were easing.
However, it turns out that this jump in the LFP rate was entirely an artifact of the BLS incorporating population control adjustments into the January labor force data. These are independent estimates of the civilian noninstitutionalized population ages 16 and older used to make sure that labor force statistics computed from the Current Population Survey (CPS) accurately reflect the population and are incorporated into the CPS data each January. The latest adjustments are the first to use information from the 2020 decennial census , and showed that the US population was almost 1 million larger than the published estimate for December 2021. By itself, a jump in the size of the population isn't an issue for comparing LFP rates over time. But the new population adjustments also showed that the population was considerably younger than previously estimated (in particular, the share of the population aged 70 and older was smaller). This shift in the age distribution is important because a younger population generally means a higher rate of participation in the labor force.
The BLS does not revise the historical data when new population control adjustments are incorporated into labor statistics. But it did report that the population control adjustment would have lifted the December 2021 LFP rate for the population ages 16 and older by 0.3 percentage points if it had revised the December data. This increase is the same as the increase in the published LFP rate from December to January. In other words, the December-to-January increase in the published LFP rate didn't indicate an improvement in labor force participation at all.
Clearly the latest population control adjustments complicate comparison of 2022 LFP rates to earlier periods. To construct historical LFP rate series that are more comparable over time, we implemented a simple smoothing method the BLS used previously to account for annual population control adjustments (described here ). This method essentially distributes the level shifts that result from the population control adjustments back over the relevant historical period for each series. To account for the effects of adjustments (made between the decennial census) to the census 2010 population base that were made in January 2013–January 2021, we first smoothed data for January 2012 to December 2020. Then we smoothed the data for January 2012 to December 2021 to account for the effects of the 2020 census population control adjustment introduced in January 2022. We applied the method separately labor force participation rates for the population ages 16 and older, as well as populations ages 16–24, 25–54, and 55 and older. You can see these series in this spreadsheet
![]() .
.
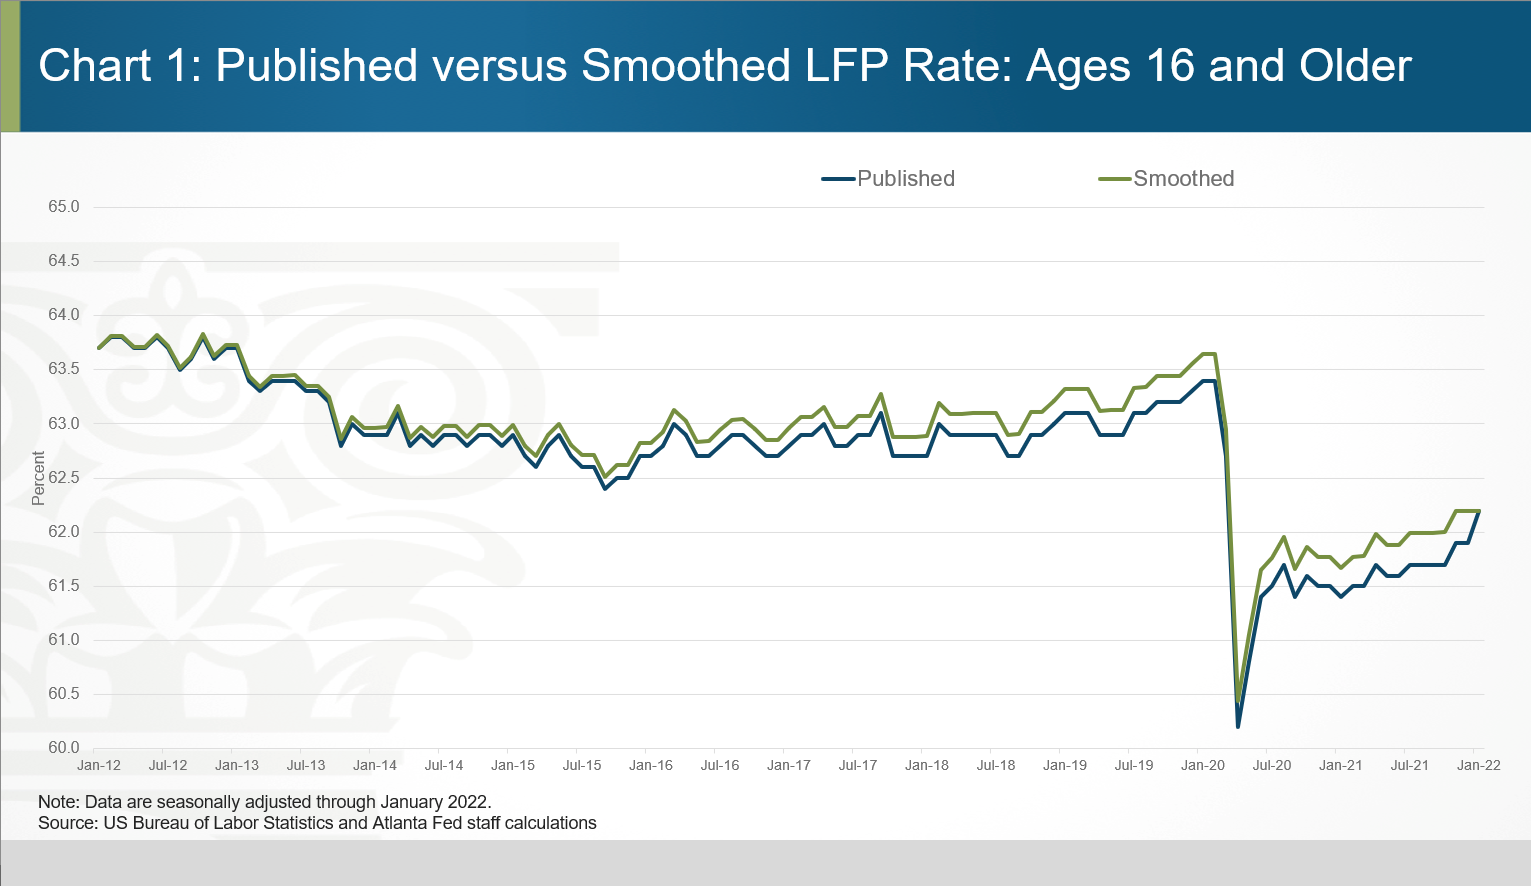
Chart 1 plots the published and smoothed seasonally adjusted LFP rate series for the population aged 16 and older. Notice that the smoothing method results in a gradually increasing upward shift to the LFP rate over the 10-year period, culminating with the December 2021 smoothed LFP rate 0.3 percentage points higher than the published LFP rate.
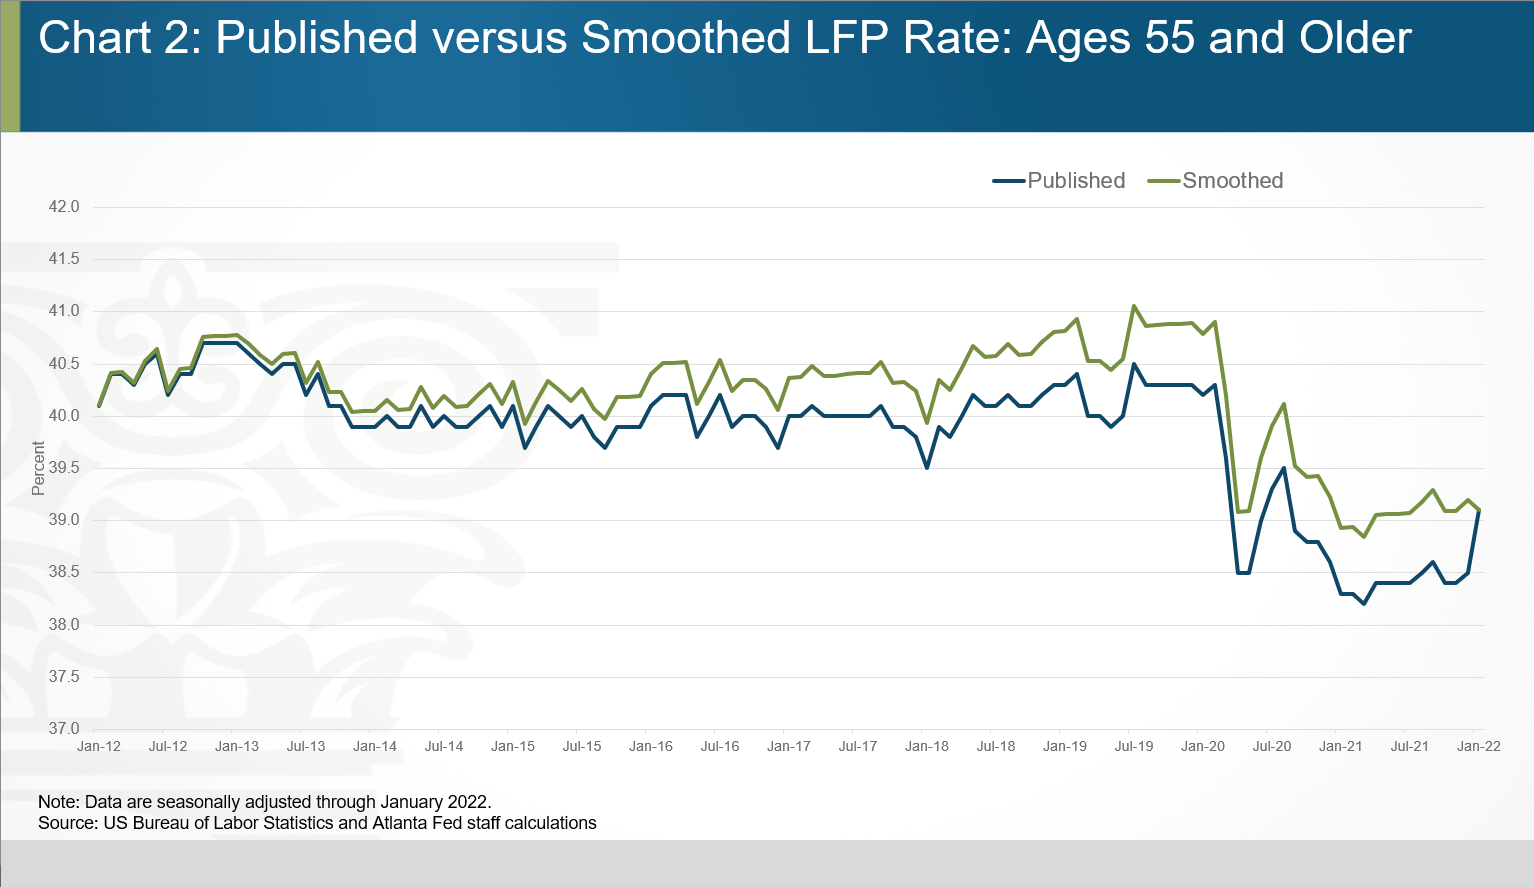
The upward shift is even greater for the population aged 55 and older shown in chart 2. Recall that a significant part of the population adjustment was a reduction in the size of the population aged 70 and older. Given that this age group has a lower LFP rate than those aged 55 to 69, the composition shift pushed the LFP rate higher for the 55 and older population overall. The BLS estimated that the population adjustment impact on the December 2021 LFP rate for this population group was 0.7 percentage points.
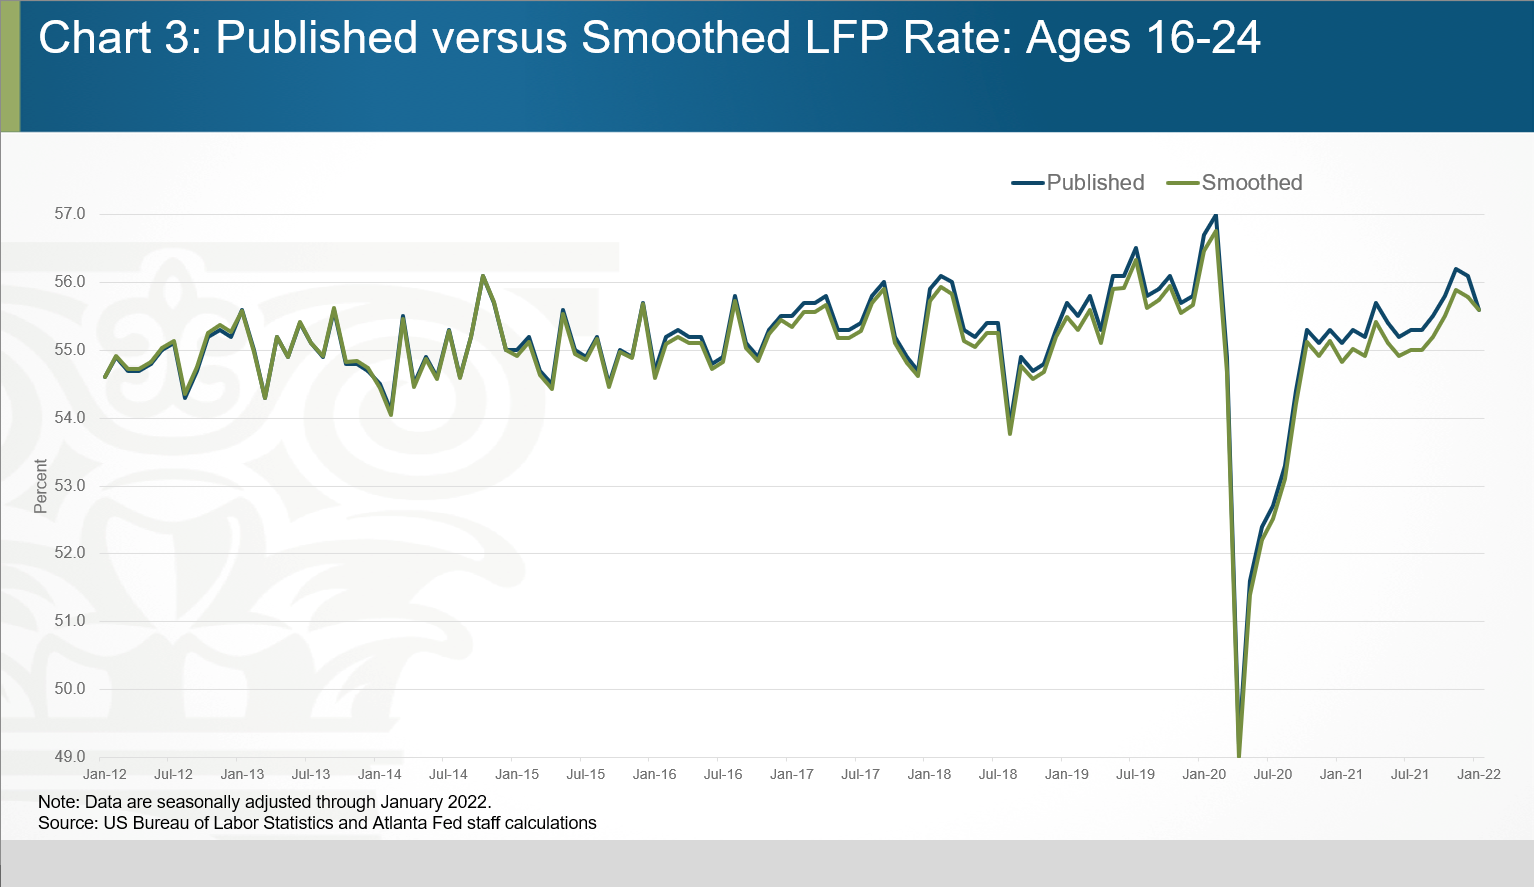
For the population aged 16–24, the smoothed series shown in chart 3 is lower than the published series through December 2021. This is because the population adjustments revealed that the population aged 16–19 was larger than previously estimated. Because the 16–19 age group has a lower LFP rate than those aged 20–24, the smoothed LFP rate series is lower than the published series. The BLS estimated that the population adjustment impact on the December 2021 LFP rate for this population group was −0.3 percentage points.
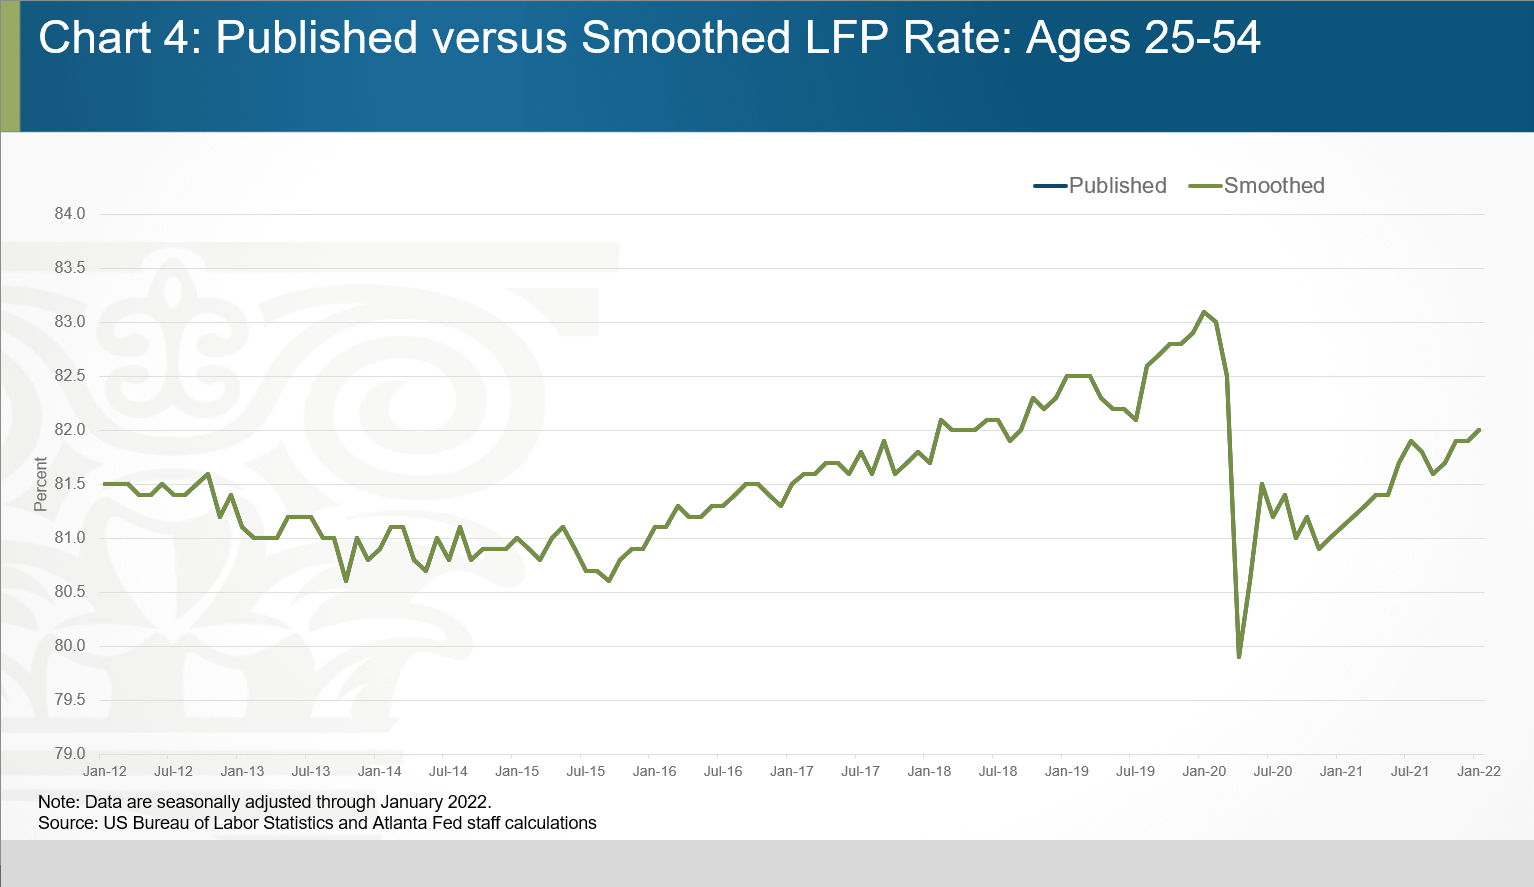
Finally, for the prime-age population (25–54), the smoothed series shown in chart 4 is identical to the published series. The population adjustments had no effect on the LFP rate for this age group.
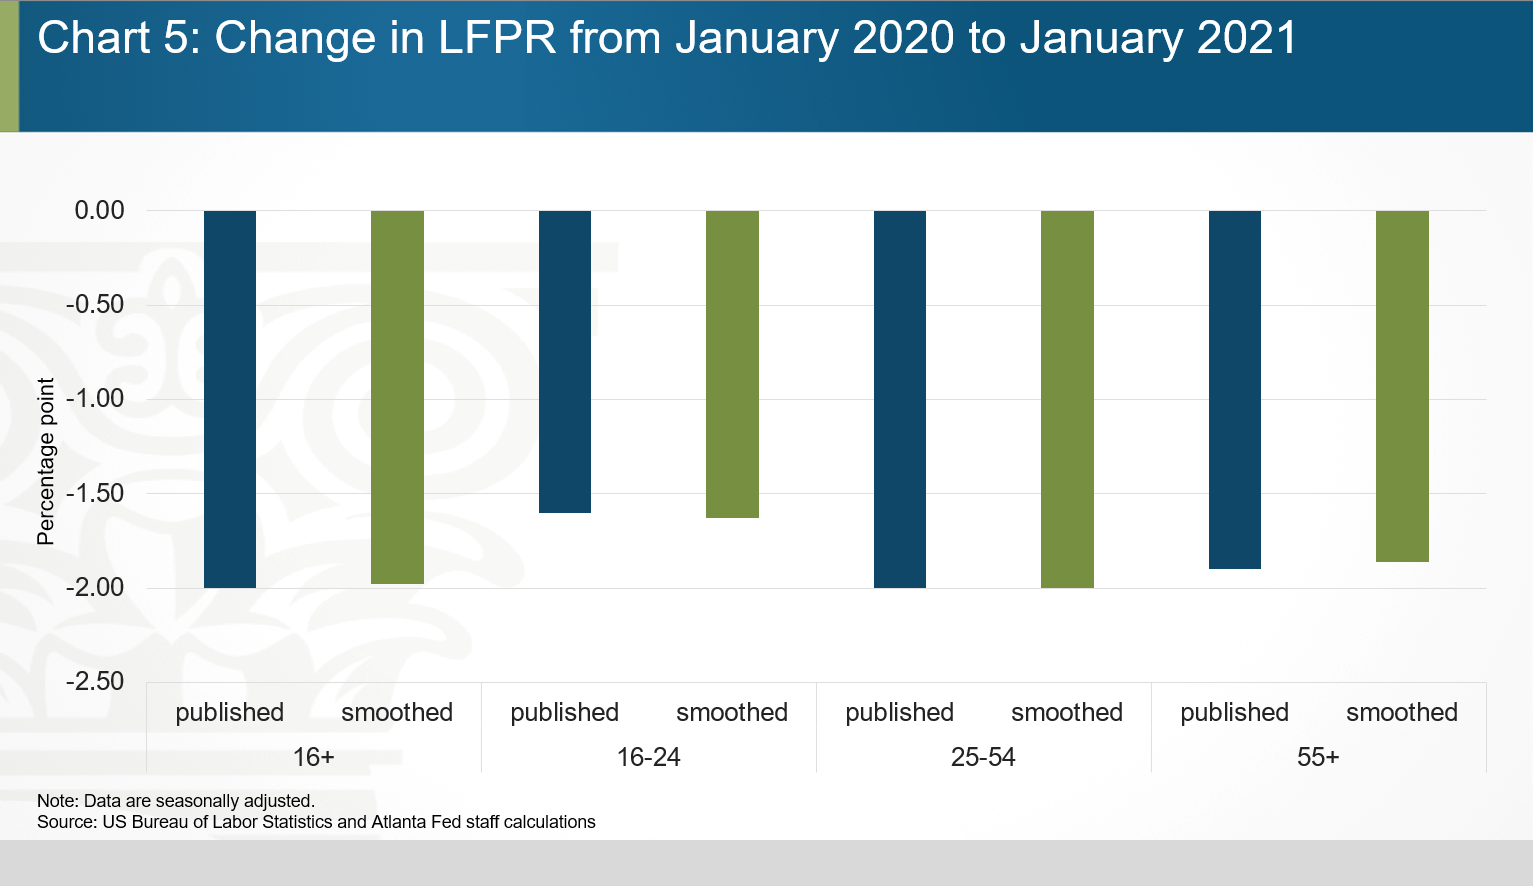
It is important to consider how the difference between the published and smoothed series may alter one's assessment of labor market dynamics surrounding the pandemic-induced recession and subsequent recovery. Chart 5 shows that for the initial year of the pandemic, measured here as the change in the LFP rates from January 2020 to January 2021, the published LFP rate data (blue bars) and the smoothed estimates (green bars) tell a very similar story for all age groups: LFP rates declined between 1.5 percentage points and 2.0 percentage points for all age groups, with no material difference in the size of the change between the smoothed and published estimates within each age group.
However, the story is much different for the period between January 2021 and January 2022. Chart 6 depicts this difference, showing that the published LFP rate for the population aged 16 and over increased by nearly 0.8 percentage points over that 12-month period. In contrast, the corresponding smoothed estimate increased by only 0.5 percentage points. The discrepancy is even greater for the population aged 55 and older. For that age group, the published LFP rate increased by 0.8 percentage points, whereas the smoothed LFP rate shows an increase of less than 0.2 percentage points during the past year. That is, the smoothed data suggest the increase was less than one quarter as large as the increase in the published data. For the population aged 16–24, the smoothed LFP rate increased by more than the published series (0.7 percentage points versus 0.5 percentage points). Finally, for the population aged 25–54, there is essentially no difference between the change in the published and smoothed estimates. Both increased by close to 0.9 percentage points from January 2021 to January 2022.
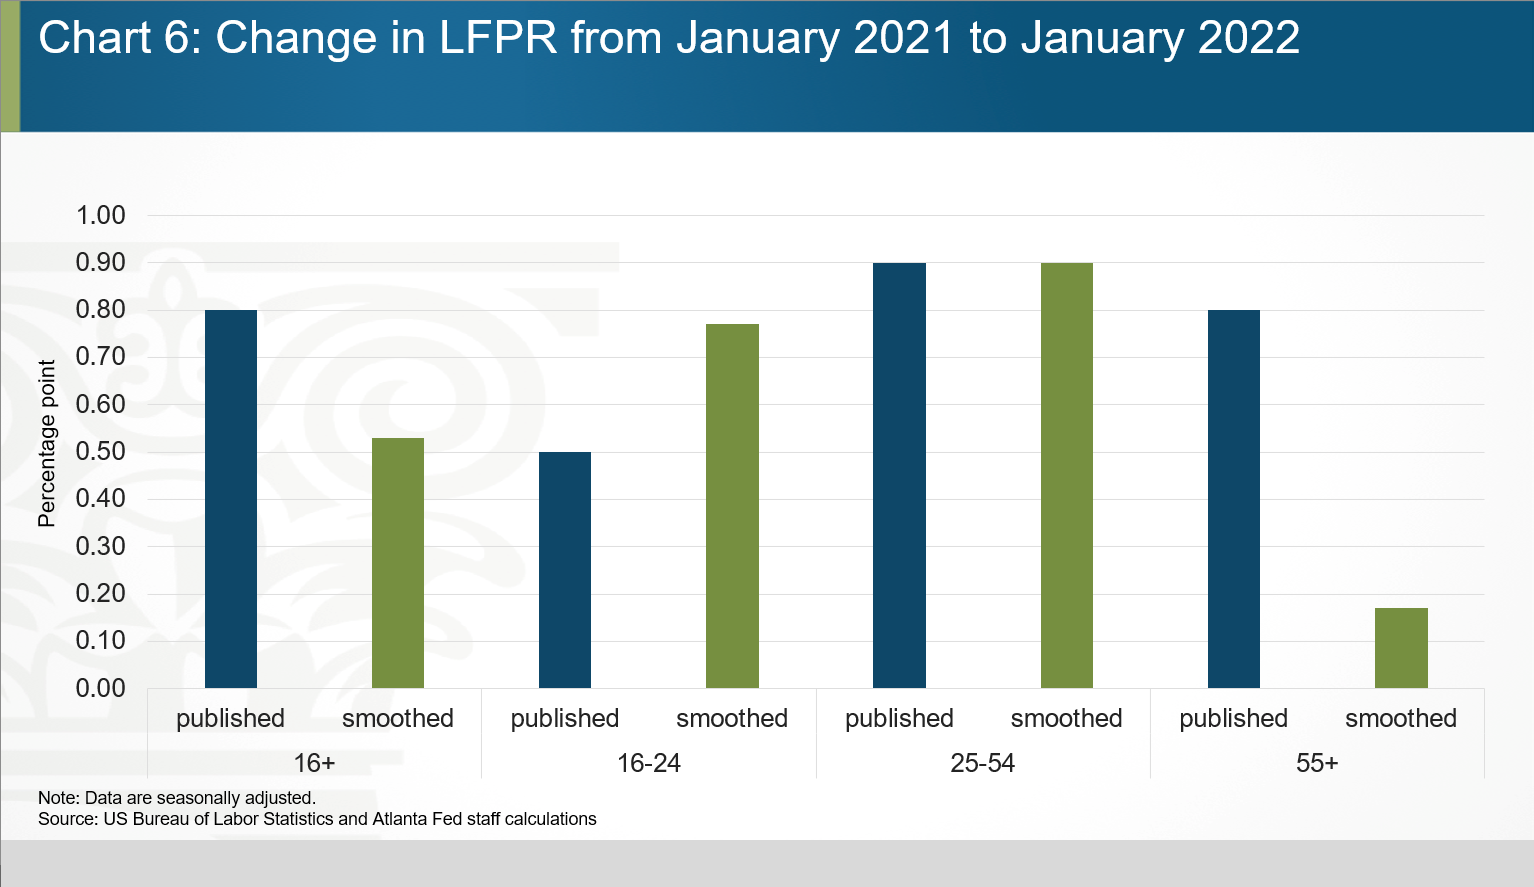
To sum up, smoothing the labor force data to account for the annual population adjustments like that described here provides a way to allow LFP rates in 2022 to be compared to prior years. These estimates show that the recovery from January 2021 to January 2022 in the overall LFP rate and the rate for the population aged 55 and older is more modest than the published data would imply, while the recovery for the population aged 16-24 is better than implied by the published estimates.
Going forward, the published labor force data for January 2022 will be comparable with data for other months in 2022 since they are all based on the same population control adjustments. In January 2023, the BLS will likely incorporate new population adjustments that use additional 2020 census information. Hopefully those adjustments will be less eventful. Stay tuned as we discuss future data.


