Note: The author thanks Mark Jensen and Larry Wall for their help with this post.
The Federal Open Market Committee (FOMC) implements monetary policy chiefly through changes in its federal funds rate target, and market participants form expectations about the evolution of future monetary policy decisions based on data they think are relevant to policymakers. Between the June and July FOMC meetings, incoming data started to suggest some parts of the economy might already be feeling the effects of tighter monetary policy. On the other hand, data since July tell a different story, one that suggests the FOMC still has a way to go in its efforts to fight inflation and restore price stability. So how have market participants interpreted these disparate pieces of data, and what could they mean for future monetary policy decisions?
In this post, I use the Atlanta Fed's Market Probability Tracker to understand how data since the June and July FOMC meetings have affected the market's expectations about the path of future monetary policy, similar to the analysis I did with Atlanta Fed economist Mark Jensen in a Macroblog post late last year. As another Atlanta Fed colleague, Mark Fisher, and I discussed in a Notes from the Vault article, the Market Probability Tracker generates estimates of the expected federal funds rate path based on eurodollar futures and options on eurodollar futures. Eurodollar futures and options deliver a three-month LIBOR (the London interbank offered rate) interest rate average, which is closely linked to the federal funds rate. Additionally, eurodollar futures and options are among the most liquid of financial instruments, with contracts that are expiring several years in the future regularly traded. As a result, the Market Probability Tracker generates our best estimates of expected rate paths by incorporating all the available data that the market believes will affect future policy decisions.
Figure 1 below uses the expected rate paths produced by the Market Probability Tracker to illustrate how market expectations between the June and July FOMC meetings responded to new information about the economy. The solid black line in figure 1 below shows the federal funds rate path expected by market participants after the FOMC's meeting press conference on June 15 ![]()
![]() . The black dotted and dashed lines represent, respectively, expectations after Fed chair Jerome Powell's Senate Banking Committee testimony on June 22
. The black dotted and dashed lines represent, respectively, expectations after Fed chair Jerome Powell's Senate Banking Committee testimony on June 22![]() and after the release of the US Department of Labor's weekly report of unemployment insurance initial claims
and after the release of the US Department of Labor's weekly report of unemployment insurance initial claims ![]()
![]() on June 30. Although economic updates occurred throughout the intermeeting period (the New York Fed maintains a list of important releases going back to 2018 in its Economic Indicators Calendar), the changes in expectations on these two dates best summarize the overall change in the market's expectations. Lastly, the solid orange line represents expectations following the FOMC's press conference
on June 30. Although economic updates occurred throughout the intermeeting period (the New York Fed maintains a list of important releases going back to 2018 in its Economic Indicators Calendar), the changes in expectations on these two dates best summarize the overall change in the market's expectations. Lastly, the solid orange line represents expectations following the FOMC's press conference![]() on July 27. I also include (shaded in gray) the target range of 225 to 250 basis points announced at that meeting.
on July 27. I also include (shaded in gray) the target range of 225 to 250 basis points announced at that meeting.
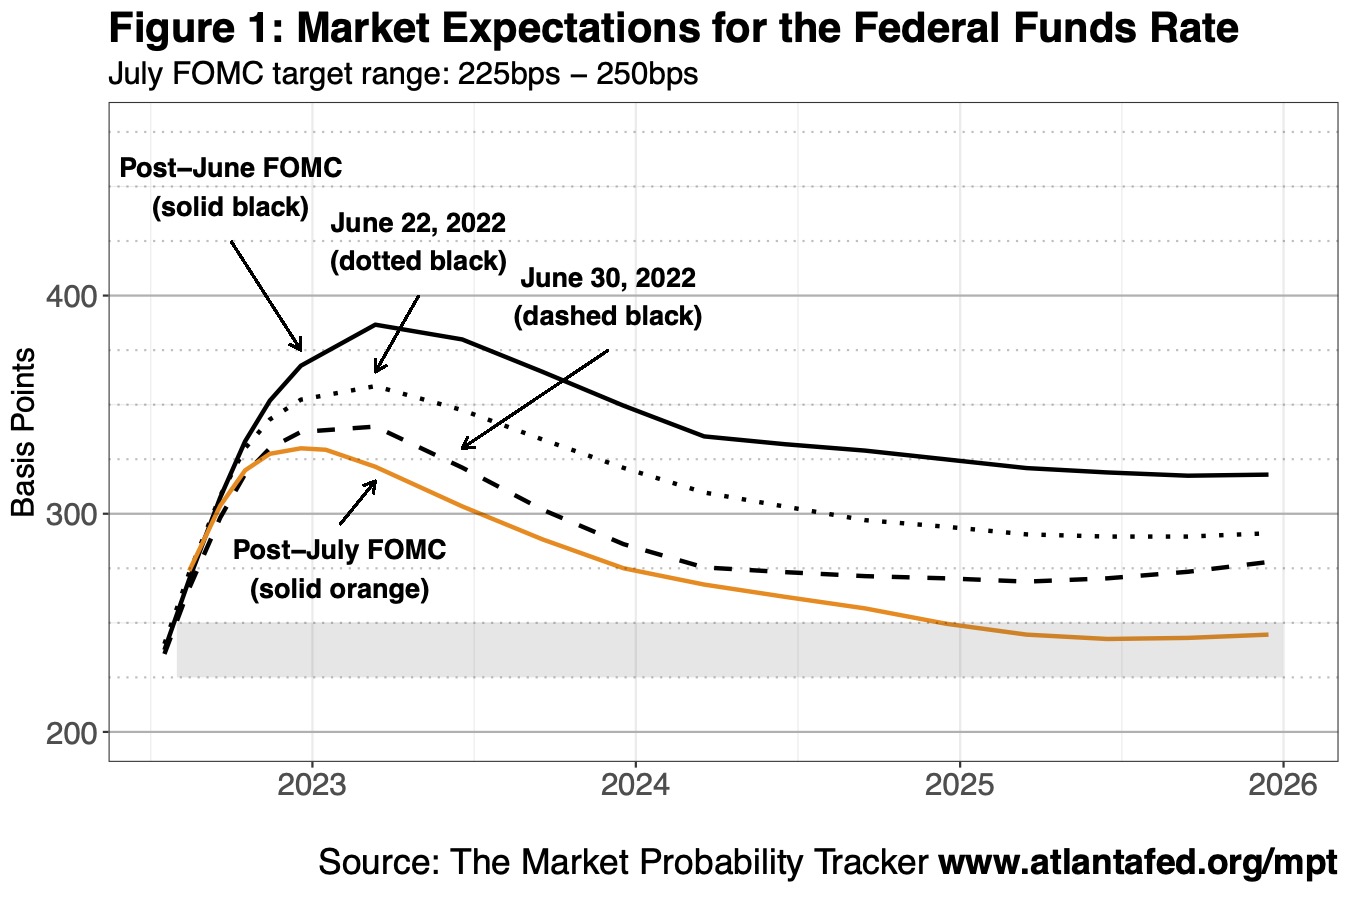
Starting with the black dashed line, after the June FOMC meeting, market participants expected the federal funds rate target range to reach 375 to 400 basis points by the first quarter of 2023 and then fall 75 basis points over the course of the next two years. During his June 22 Senate Banking Committee testimony, Chair Powell said that an economic downturn triggered by rate hikes to tame inflation was "certainly a possibility," although he added that such a downturn was neither the Fed's intent nor, in his view, necessary. His statement was important, albeit qualitative, information for the market because the FOMC in the past has often responded to economic downturns by lowering interest rates, which market participants interpreted as lower overall federal funds rates in the future (represented by the dotted black line). Expectations fell even lower after the Department of Labor's June 30 report hinted at a moderating labor market, with initial claims near five-month highs (represented by the dashed black line). By the July FOMC meeting (represented by the orange line), market participants further expected rate hikes to end this year and then fall 100 basis points during the next two years, as subsequent initial unemployment claims reports remained elevated and the July 21 Philadelphia Fed's manufacturing survey showed a drop in activity.
Figure 2 shows the Market Probability Tracker's estimates of the federal funds rate path expected by market participants following the July FOMC meeting (the solid orange line). It also shows the expected rate path following the August 5 release of the July employment situation report![]() from the US Bureau of Labor Statistics (represented by the dotted black line), the expected rate path following the September 8 release of the initial unemployment claims report (represented by the dashed black line), and the expected rate path following the September 13 release of the August consumer price index
from the US Bureau of Labor Statistics (represented by the dotted black line), the expected rate path following the September 8 release of the initial unemployment claims report (represented by the dashed black line), and the expected rate path following the September 13 release of the August consumer price index![]() (represented by the dot-dash line). Much like figure 1, these dates best summarize how market participants reacted to the evolving data since the July FOMC meeting (despite many other data releases occurring throughout the intermeeting period). Lastly, the solid black line represents the expected rate path on September 20, the day before the press conference following the FOMC meeting.
(represented by the dot-dash line). Much like figure 1, these dates best summarize how market participants reacted to the evolving data since the July FOMC meeting (despite many other data releases occurring throughout the intermeeting period). Lastly, the solid black line represents the expected rate path on September 20, the day before the press conference following the FOMC meeting.
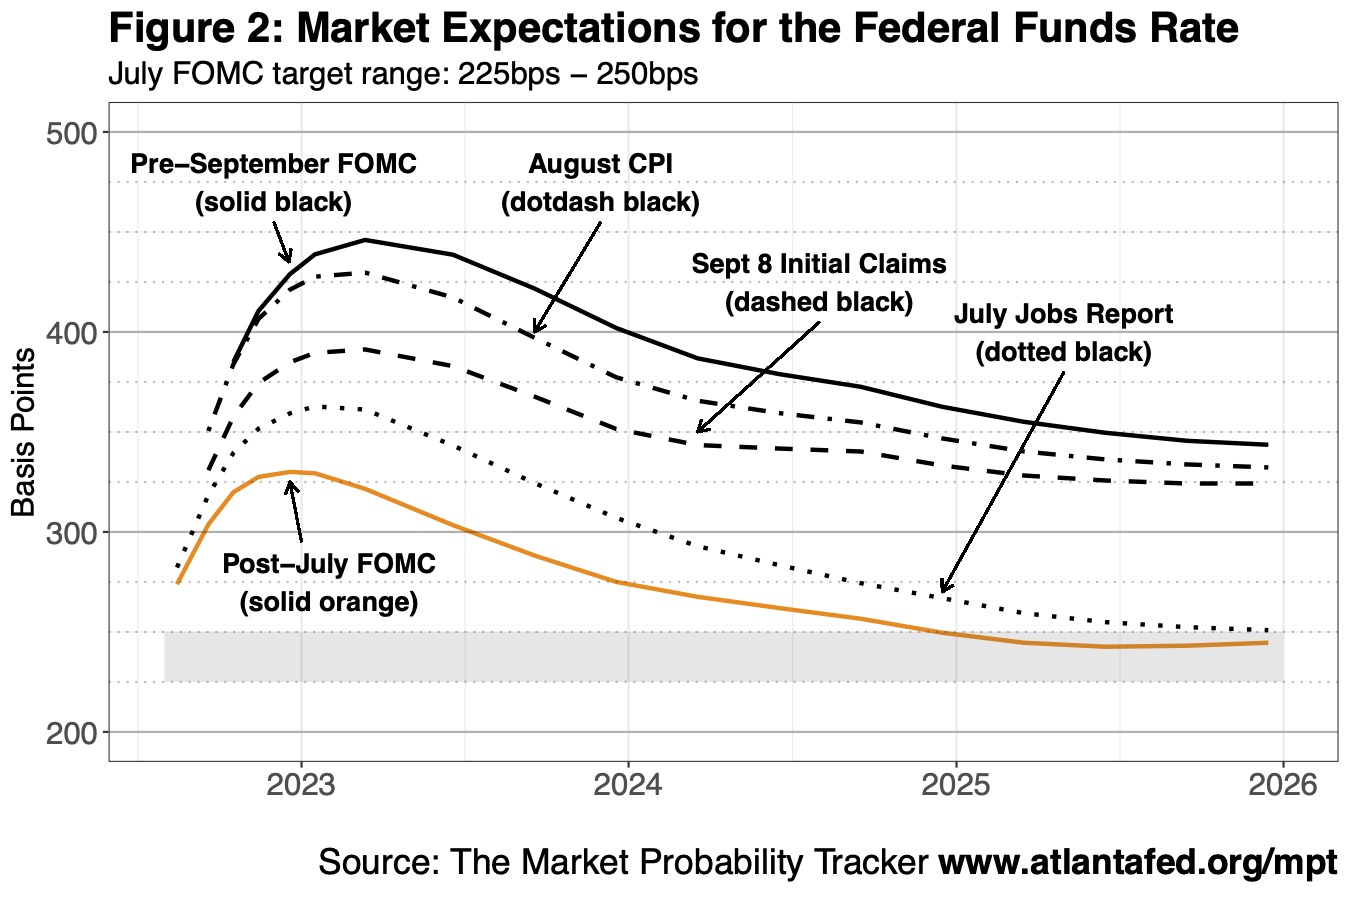
In the eight weeks since the July FOMC meeting, the data that the Committee said it would use to evaluate future policy moves came in much stronger than expected. Rather than moderating, labor markets appeared to tighten, with the Bureau of Labor Statistics reporting a 526,000 increase in nonfarm payrolls in its July jobs report and the Department of Labor reporting a decline in initial unemployment claims throughout August that culminated, in the September 8 report, in their lowest reported levels since May. The consumer price index for August, which many had expected to fall on a month-over-month basis![]() , showed inflation increasing 0.1 percent from July. The less-volatile core measure of inflation that excludes gasoline and food prices also rose 0.6 percent from July, twice the expected rate. Given the data's direction leading up to the September FOMC meeting, market participants expected a more aggressive pace of rate hikes through the end of the year, from 325 basis points after the July FOMC meeting to nearly 450 basis points. They also expect rates to remain much higher for much longer, with rates at the end of 2025 near 350 basis points—which would be at least 100 basis points higher than the 225 to 250 basis points that the chair described as the "neutral" policy rate at his July press conference.
, showed inflation increasing 0.1 percent from July. The less-volatile core measure of inflation that excludes gasoline and food prices also rose 0.6 percent from July, twice the expected rate. Given the data's direction leading up to the September FOMC meeting, market participants expected a more aggressive pace of rate hikes through the end of the year, from 325 basis points after the July FOMC meeting to nearly 450 basis points. They also expect rates to remain much higher for much longer, with rates at the end of 2025 near 350 basis points—which would be at least 100 basis points higher than the 225 to 250 basis points that the chair described as the "neutral" policy rate at his July press conference.
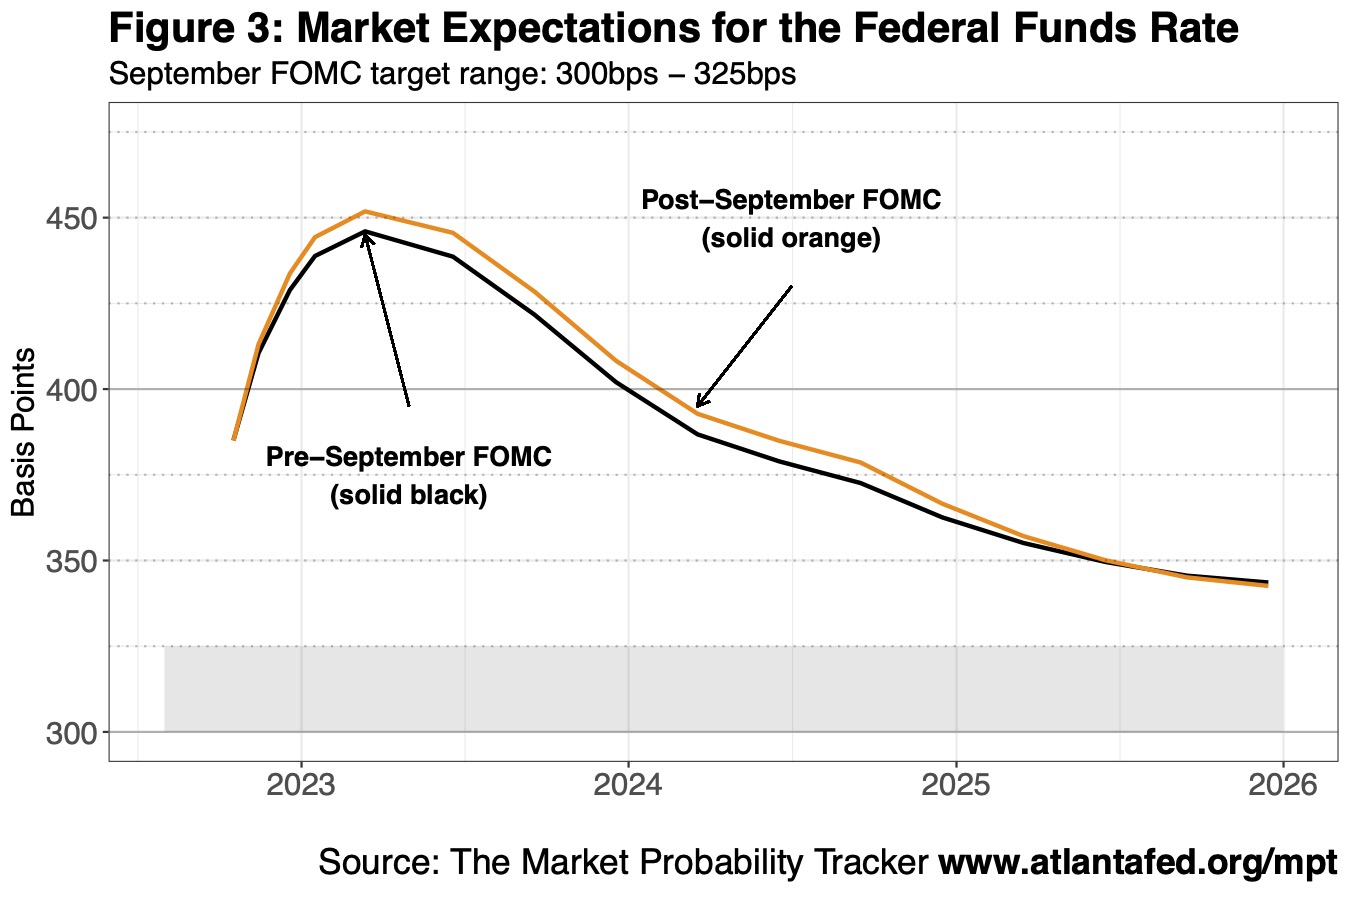
Figure 3 shows the Market Probability Tracker's estimates of the federal funds rate paths that market participants expected the day before the press conference following September's meeting (the solid black line), and after the press conference on September 21 ![]()
![]() (the solid orange line). Chair Powell, in his opening remarks, commented that tight labor markets "continue to be out of balance" with demand and that "price pressures remain evident across a broad range of goods and services." The information contained in both the press conference and the material released by the Committee did not significantly change market expectations about the future path of monetary policy, which already incorporated recent data on inflation and labor market conditions.
(the solid orange line). Chair Powell, in his opening remarks, commented that tight labor markets "continue to be out of balance" with demand and that "price pressures remain evident across a broad range of goods and services." The information contained in both the press conference and the material released by the Committee did not significantly change market expectations about the future path of monetary policy, which already incorporated recent data on inflation and labor market conditions.
Turning back to the question posed by this post's title, the rate path movements seen in reaction to the incoming data show that, initially, market participants expected rate hikes to end in 2022. But the data, which came in much stronger after the July FOMC meeting, led the market to expect the Fed to raise rates higher than had been expected following the June FOMC meeting. Market participants also expect the Fed to keep those rates much higher for longer in order to cool demand—as Chair Powell put it in his August 26 speech![]() at the Jackson Hole economic policy symposium, "until we are confident the job is done."
at the Jackson Hole economic policy symposium, "until we are confident the job is done."
More importantly, the movements in the rate paths highlight the insights we can gain from the Market Probability Tracker into how information about the economy affects the market's expectations of future monetary policy decisions. Chair Powell observed during the June press conference that "monetary policy is more effective when market participants understand how policy will evolve." With the rate paths produced by the Market Probability Tracker each day, we can begin to make that assessment.

By Brian Robertson, a quantitative financial markets adviser in the Atlanta Fed's Research Department