According to payroll survey![]() data from the US Bureau of Labor Statistics (BLS), average weekly hours per job rose during 2020 and 2021 and have since returned to close to their prepandemic average levels. The orange line in the following chart, which estimates the average hours for nonfarm wage and salary jobs in the private sector, depicts this movement.
data from the US Bureau of Labor Statistics (BLS), average weekly hours per job rose during 2020 and 2021 and have since returned to close to their prepandemic average levels. The orange line in the following chart, which estimates the average hours for nonfarm wage and salary jobs in the private sector, depicts this movement.
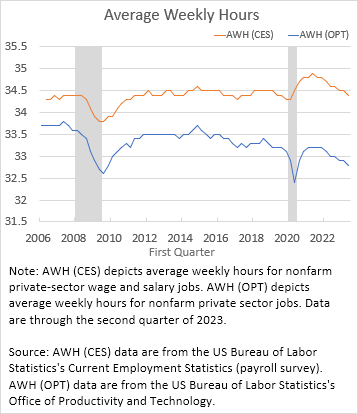
The basic narrative for the payroll survey measure since 2020 is that—in the face of unprecedented labor shortages following the COVID-19 pandemic—employers in many industries (especially those providing in-person services) increased the hours of their staff to try and make up for the shortage of workers. As worker shortages eased, average hours per job have returned to a prepandemic level. As the chart makes clear, this pattern contrasts with the experience during the Great Recession, when employers reduced average hours and only gradually increased them as the economy recovered.
However, the payroll survey's measure of average weekly hours is an estimate of the average hours paid per job, not the hours worked per job. Looking at hours worked provides a better perspective on the supply of hours going into producing goods and services in the economy than looking at the hours paid does. To estimate average hours worked, the BLS adjusts the payroll survey's hours-paid data to an hours-worked basis (and broadens the scope to include self-employed workers). The adjustment accounts for paid time off (sick leave, paid vacation, holidays, and family leave) as well as unpaid, off-the-clock hours worked (see here![]() for details on the methodology). An increase in paid time off reduces hours worked relative to hours paid, while an increase in unpaid work increases hours worked relative to hours paid.
for details on the methodology). An increase in paid time off reduces hours worked relative to hours paid, while an increase in unpaid work increases hours worked relative to hours paid.
In the above chart, the blue line shows the nonfarm business sector's average weekly hours series, accounting for adjustments by the BLS. This measure of average hours paints quite a different picture from the payroll survey measure: not only is it lower than average hours paid, but the gap between the two measures has grown as average hours worked has drifted lower—especially after 2015. Average weekly hours worked was 33.7 in 2006, 33.5 in 2015, and 32.8 hours in 2023. As a result, the gap between average hours paid and average hours worked has increased by almost an hour a week since 2006.
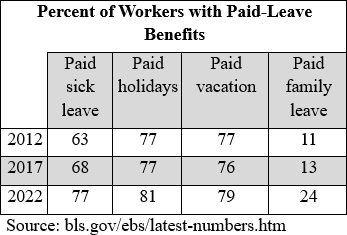
The primary driver of the divergent trends in hours paid and hours worked is the increasing prevalence of paid time off as a part of employee compensation. According to the BLS's National Compensation Survey![]() , the percent of private sector workers with access to paid-leave benefits has increased substantially since 2015. The following table summarizes these changes:
, the percent of private sector workers with access to paid-leave benefits has increased substantially since 2015. The following table summarizes these changes:
It is also evident from the chart that hours paid and hours worked diverged sharply at the onset of the COVID-19 pandemic: average hours worked fell whereas average hours paid rose. In addition to increased availability of paid time off, the use of these benefits might have changed with the onset of the pandemic. As noted in a recent paper by Katharine Abraham and Lea Rendell![]() , data from the Current Population Survey
, data from the Current Population Survey![]() show that during the COVID-19 pandemic work absences resulting from illness, childcare problems, family responsibilities, and other reasons not attributable to vacation/holidays surged. To the extent that those absences were paid, then average hours worked would decline while average hours paid would not, thus temporarily widening the gap between hours paid and hours worked at the onset of the pandemic, as the chart shows.
show that during the COVID-19 pandemic work absences resulting from illness, childcare problems, family responsibilities, and other reasons not attributable to vacation/holidays surged. To the extent that those absences were paid, then average hours worked would decline while average hours paid would not, thus temporarily widening the gap between hours paid and hours worked at the onset of the pandemic, as the chart shows.
Although we think both measures of average weekly hours are useful, it's important to keep in mind that they measure different things. How many hours you're paid for each week doesn't always match how many hours you worked, a difference that can matter when calculating statistics related to labor productivity. For example, a simple decomposition of average labor productivity is:
log(Y/H) = log(Y) − log(H/E) − log(E)
where Y is output, H is total hours worked, H/E is average hours worked per job, and E is the number of jobs. Using the payroll survey's hours-paid measure, we estimate that average labor productivity is 4.3 percent higher than in 2019. But when we use the BLS's hours-worked measure, productivity is 5.7 percent higher. The latter is a better estimate of average labor productivity growth since 2019 because what matters for production are the hours worked. The hours that an employer paid for is a cost of production. Where these measures go from here is uncertain, but it seems likely that the gap between hours paid and hours worked will continue to widen as paid time off becomes even more prevalent.

By Lei Fang, research economist and associate adviser, and

John Robertson, senior policy adviser, both in the Atlanta Fed's Research Department