My colleague, T, got married last month. To celebrate, our group at the Atlanta Fed offered best wishes over a video chat and chipped in on a gift. Dispersed to home offices in Georgia, Alabama, Tennessee, and Massachusetts, here's how we anted up:
- 62 percent used a P2P payment app
- 25 percent paid with a paper check
- 13 percent paid with cash
The two-thirds of us who chose an electronic way to pay seem to be aligned with the zeitgeist. For the third quarter of 2020, various P2P payment apps reported strong growth in payment volume. These results could be due to recommendations to social distance that have us worried about getting close enough to a payee to hand over the payment.
Even before COVID-19, however, P2P services were taking off in the United States. During the latter half of the 2010s, Fed survey data show the growth of electronic P2P from the perspectives of both the financial services side and the consumer side of payments execution.
First, the financial services side. According to the Federal Reserve Payments Study![]() (FRPS), the number of noncash payments through person-to-person and money transfer (P2P&MT) services more than doubled from 2015 to 2018, increasing from 397 million to 841 million (25 percent year-over-year growth). Most of the growth came from payments initiated from websites and apps on mobile devices. Mobile P2P, for example, was up 275 percent over the three-year period. This category aggregates data from the various P2P services to give a picture of all U.S.-domiciled P2P and MT transfers handled by the covered providers but overlooks similar transactions internal to a depository institution or not made on a named P2P or MT system.
(FRPS), the number of noncash payments through person-to-person and money transfer (P2P&MT) services more than doubled from 2015 to 2018, increasing from 397 million to 841 million (25 percent year-over-year growth). Most of the growth came from payments initiated from websites and apps on mobile devices. Mobile P2P, for example, was up 275 percent over the three-year period. This category aggregates data from the various P2P services to give a picture of all U.S.-domiciled P2P and MT transfers handled by the covered providers but overlooks similar transactions internal to a depository institution or not made on a named P2P or MT system.
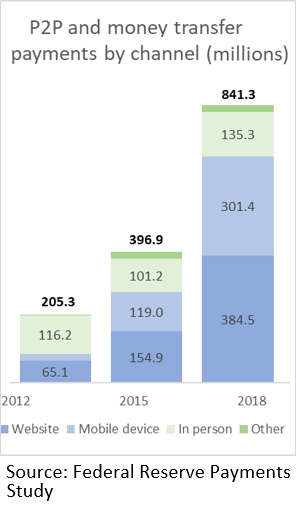
When we think of P2P, splitting the bill at a restaurant comes to mind. The average value of these payments reported in the FRPS, however, tells a different story. The average value of P2P payments drifted down from $446 in 2012 to $349 in 2015 to $246 in 2018—still quite high for a bite to eat. Other uses, such as providing financial support to a family member, repaying a roommate for a portion of the rent, or paying a household employee, are likely important, although smaller-value payments are increasing.
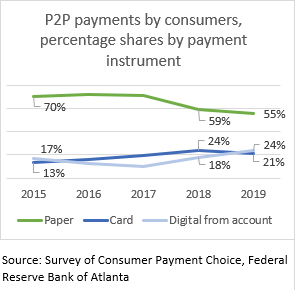
Second, the consumer side. Data from the Survey of Consumer Payment Choice (SCPC) show the whole wallet—that is, cash, paper check, and money order as well as card and digital payments from an account. Consumers also report multiple cards and accounts from (potentially) multiple providers, giving context for payment choice and, like the FRPS, aggregating information from multiple industry sources. As recently as 2017, the SCPC found that 71 percent of consumers' P2P payments were made with a paper payment instrument (cash, check, or money order). By 2019, the share of paper P2P had dropped to 55 percent. One-quarter of P2P payments were comprised of digital payments from an account, which are initiated through online banking by providing a routing and account number to the payee, or through an app such as PayPal, Venmo, or Zelle (which themselves may be executed by a card, ACH payment, or balance stored in a digital wallet). The increase in digital payments from an account and the sharp decline in paper payments reinforces what we've already seen from the financial services providers.
To learn more about these data on your own, check out the detailed data release![]() of the 2019 Federal Reserve Payments Study or play around with the interactive charts to the Survey of Consumer Payment Choice.
of the 2019 Federal Reserve Payments Study or play around with the interactive charts to the Survey of Consumer Payment Choice.
 By Claire Greene, a payments risk expert in the Retail Payments Risk Forum at the Atlanta Fed