Last week, the Federal Reserve Payments Study![]() (FRPS) documented the growth in the number and value of card payments from 2018 to 2021. The value of card payments increased 10.0 percent from 2018 to 2021; by number, the increase was 6.2 percent per year.
(FRPS) documented the growth in the number and value of card payments from 2018 to 2021. The value of card payments increased 10.0 percent from 2018 to 2021; by number, the increase was 6.2 percent per year.
Diving a little deeper, we can look at the ups and downs over the period 2018 to 2021. That’s because the FRPS has collected the number and value of credit, non-prepaid debit, and debit card payments annually since 2015 (expanding on the data collected every three years beginning in 2000). The annual data show that in 2020, the first year of the COVID-19 pandemic, the number and value of card payments dropped. The drop was unprecedented in the history of the FRPS. (Quarterly data![]() for 2020 trace the path of the pandemic, with a peak in February and a trough in April.)
for 2020 trace the path of the pandemic, with a peak in February and a trough in April.)
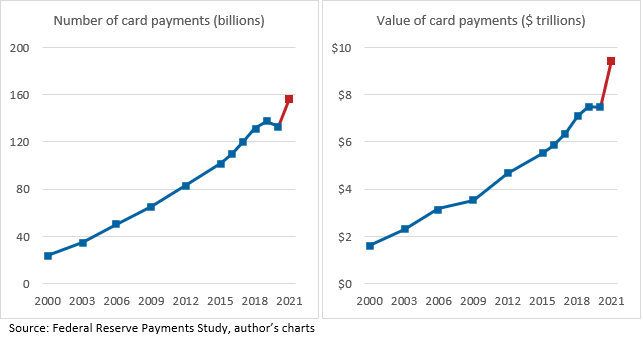
In 2021, that drop was more than reversed. The rate of increase in the value of card payments was almost two-and-a-half times the increase recorded in any prior one-year period: 26.4 percent. By number, the increase was 80 percent greater than any prior annual increase: 18.3 percent. These are big changes, as you can see in the slopes of the lines in the charts below (2020–21 highlighted in red).
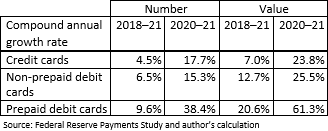
What type of cards contributed most to this jump? The table below shows that while growth rates for all card types accelerated in 2021, the growth in payments with prepaid debit cards stood out. Keep in mind, however, that prepaid debit cards were growing on a small base: in 2020, just 10 percent of card payments by number and 5 percent by value were made with prepaid cards.
We ask ourselves lots of questions about the pandemic. Will behavior changes stick? When will things get back to normal (however you define that)? Will card payments make up for lost time? There, at least, the answer is clear.
You can see all the data here![]() .
.

By Claire Greene, payments risk expert in the Retail Payments Risk Forum at the Atlanta Fed