Regular readers of Policy Hub: Macroblog will recall my description last year of smoothed labor force data, which reflect the latest population control adjustments by the US Bureau of Labor Statistics (BLS). I'm writing this post to let you know that I have updated those smoothed labor force data to incorporate the latest adjustments. You can find these smoothed series in this spreadsheet![]() . As you may recall, each January, the BLS incorporates updated population estimates from the US Census Bureau into the data from the household survey used to construct important statistics such as the labor force participation (LFP) rate and unemployment rate. The BLS noted
. As you may recall, each January, the BLS incorporates updated population estimates from the US Census Bureau into the data from the household survey used to construct important statistics such as the labor force participation (LFP) rate and unemployment rate. The BLS noted ![]()
![]() that the majority of the overall population change incorporated into the latest adjustment reflected recent increased international migration, following a period of subdued international migration due to the pandemic, along with various methodological improvements.
that the majority of the overall population change incorporated into the latest adjustment reflected recent increased international migration, following a period of subdued international migration due to the pandemic, along with various methodological improvements.
The BLS does not revise historical data to incorporate the population control adjustments, a fact that could make comparisons of labor force data over time a bit misleading. However, the BLS does show the impact of the population adjustments for a selection of labor force series and population characteristics for December of the preceding year. To construct historical labor force series that are more comparable over time, I use those estimated impacts to implement a simple smoothing method the BLS used previously to account for annual population control adjustments (described here ![]()
![]() ). This method essentially distributes the level shifts that result from the population control adjustments back over the relevant historical period for each series.
). This method essentially distributes the level shifts that result from the population control adjustments back over the relevant historical period for each series.
More specifically, I first smoothed data for each year from 2012 to 2020 (2012 being the year when the 2010 census estimates were first incorporated). Then, I smoothed the data for 2012 to 2021 to account for the effects of the 2020 census population control adjustment introduced in January 2022. Finally, I smoothed the data for 2022 to reflect the latest population control adjustment introduced in January 2023. I applied this method separately to the statistics for which the BLS provides population adjustment impact estimates, and I adjusted the data using (where available) published seasonal adjustment factors. The linked spreadsheet![]() contains smoothed estimates for the population, labor force, employment, labor force participation rate, and employment-to-population rate for selected population characteristics for 2012 through 2022.
contains smoothed estimates for the population, labor force, employment, labor force participation rate, and employment-to-population rate for selected population characteristics for 2012 through 2022.
As the following table shows, the effect of the latest population-control adjustment on broad age-group labor force participation rates for December 2022 was generally smaller than the impact of last year's adjustment on the December 2021 participation rates.
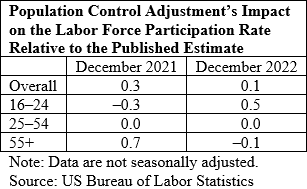
For example, the BLS estimated that the population adjustment impact on the December 2021 LFP rate for the population aged 55 and older group was 0.7 percentage points, and this adjustment contributed to a 0.3 increase in the overall LFP rate relative to the published estimate. The BLS also estimated that the population-adjustment impact on the December 2021 LFP rate for the population aged 16–24 was −0.3 percentage points.
For December 2022, the BLS estimates that the LFP rate for the overall 55-and-older population would have been 0.1 percentage points lower than the published data indicated. Looking at the underlying population data, it appears that this adjustment resulted from an increase in the estimated size of the population aged 75 and older (up 1.5 percent, an unusually large amount, in the published population estimate between December 2022 and January 2023) and a decline in the population aged 65–69 (down 1.4 percent between December and January). At the other end of the age spectrum, the LFP rate for the 16–24 population would have been 0.5 percentage points higher than the published estimate. This adjustment seems to be the result of an increase in the estimated size of the size of the population aged 20–24 (the published estimate of the population aged 20–24 rose 5 percent between December and January, whereas the size of population aged 16–19 was essentially unchanged).
Chart 1, which compares the smoothed and published LFP rate for the population aged 16 and older, depicts the impact of smoothing on the historical data.
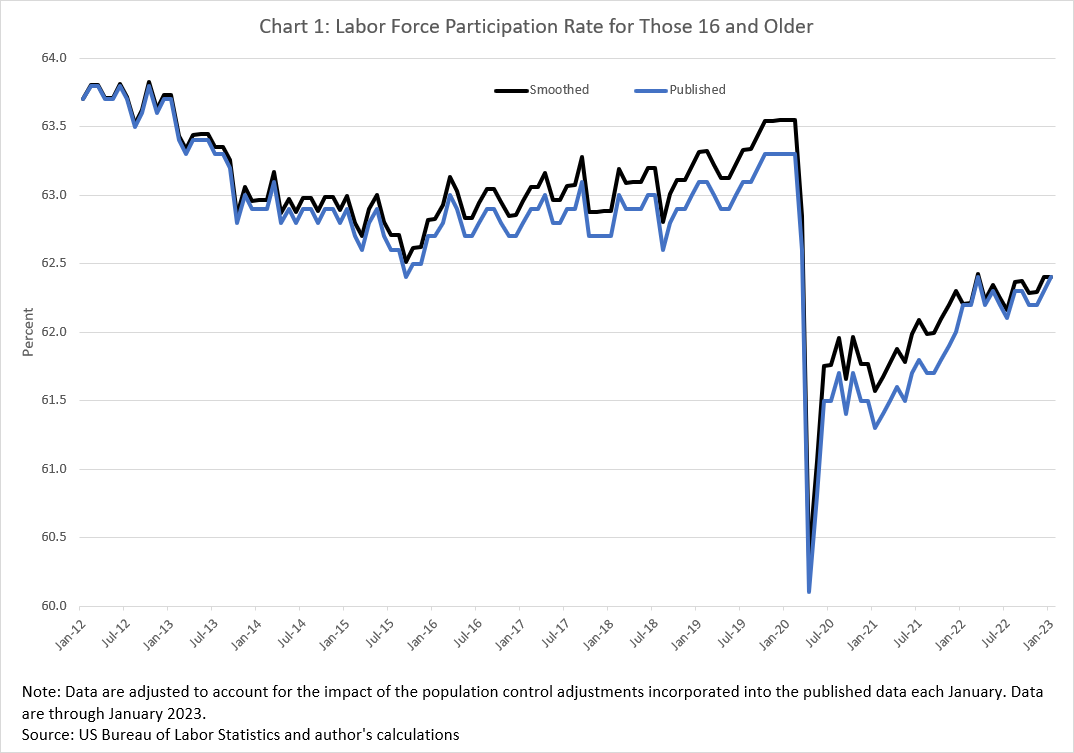
The latest population adjustments don't significantly affect the basic story of the overall LFP rate. This rate changed little over the course of 2022 and is still lower than it was pre-COVID, and the pre-COVID LFP rate was probably higher than the published data suggest. The biggest factor influencing the recent behavior of the overall LFP rate has been the lower participation by the population aged 55 and older, which reflects the combination of an aging population and a greater propensity of the older population to be retired than they were pre-COVID (see, for example, this recent study ![]()
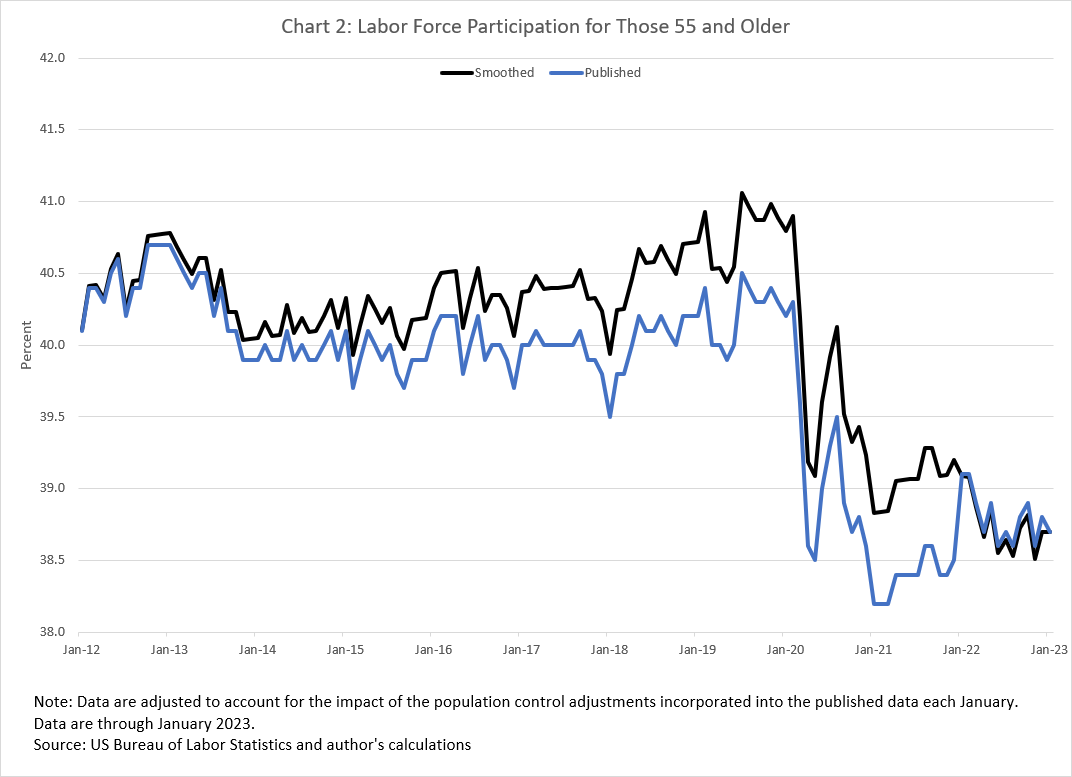
![]() ). This drop in participation by the older population is evident in chart 2, which compares the smoothed and published LFP rates for the population aged 55 and older.
). This drop in participation by the older population is evident in chart 2, which compares the smoothed and published LFP rates for the population aged 55 and older.
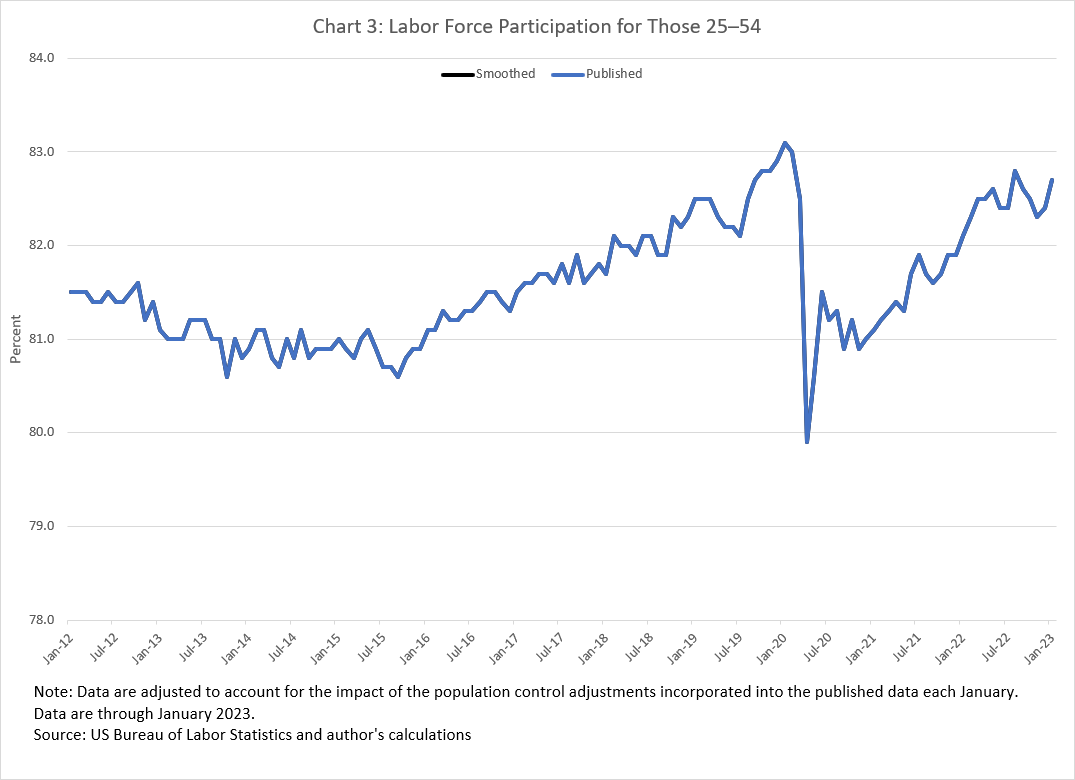
Similar to last year, the population control adjustment didn't affect the LFP rate for the overall 25–54 (prime) age group. As chart 3 shows, there is no difference between the smoothed and published prime-age LFP rates, and they have been fluctuating during the last year at close to their pre-COVID levels.
Later this year, the Census Bureau will publish updated monthly population estimates and projections for 2022 and 2023 for individual ages that will allow more careful adjustments to LFP rates for finer age groups than the BLS provided. In the meantime, I hope you find the smoothed labor force series![]() useful.
useful.

By John Robertson, a senior policy adviser in the Atlanta Fed's Research Department