
The Digital Divide and the Pandemic: Working from Home and Broadband and Internet Access
Stuart Andreason, Pearse Haley, Sarah Miller, and Mels de Zeeuw
June 29, 2020
2020-06
https://doi.org/10.29338/wc2020-06
Download the full text of this paper (1,025 KB) ![]()
The ongoing COVID-19 pandemic has had significant impacts on the national economy. Business disruptions, employment dislocations or furloughs, and shelter-in-place orders have occurred across the nation. Some states and metropolitan areas—depending on their economic makeup and composition of industries, business sectors, and major employment opportunities—have experienced disproportionately negative effects as a result of public health measures, particularly regions with high concentrations of hospitality, tourism, arts and entertainment, and agriculture. The industrial makeup of a metropolitan area or state is an important factor in how it experiences economic disruptions, and concentrations of certain industries in a region make it more or less resilient and can affect its ability to rebound from a negative economic shock.1 Similar to effects felt in the industrial Midwest by other economic shifts and shocks over the last several decades, we know these places with heavily “nontraded” sector economies are likely feeling disproportionately negative economic effects of the COVID-19 pandemic.
While industrial composition—meaning the key areas or industries of a regional economy such as manufacturing, life science, or tourism—is one of the critical factors that could drive how deeply communities experience the economic shocks associated with the pandemic, it is not the only one. A community’s technology infrastructure and the ability of its workers to work remotely are also critically important. Even among industries that can shift to remote work, many workers lack the necessary access to broadband or internet capacity and equipment to work from home. Regardless of broadband availability, access to the internet also varies regionally, especially when considering the type of internet access and tech or mobile device available to connect to the internet. Through this pandemic we’ve seen evidence of the widening digital divide in terms of both access and affordability.
Additionally, while broadband and internet access can be a challenge in rural communities, it is also a challenge in low-income communities and for low-income families even when high-speed internet is available. Many families simply cannot afford to subscribe to a service. Other families economize, subscribing to a mobile data plan only. Using a phone or tablet creates significant impediments to working remotely and can prevent it altogether. Using only a mobile device to access the internet created significant barriers to services for many people affected by the pandemic. For example, many states did not have mobile-enabled websites for filing unemployment claims. Some systems, as in Florida, have adapted, changing their access to allow for mobile-enabled service. Nevertheless, this barrier illustrates the many barriers that mobile-only internet access presents.
Another major factor collided with the inability to access broadband and internet service, creating a double-down effect on working from home in the wake of the COVID-19 public health responses: many workers did not have the type of job that would allow them to work at home.
To understand which areas are more, or less, affected by these two factors, we examined states and regions both with a concentration of businesses not likely to have work-from-home capabilities and where workers reported their ability to work from home by industry. We then explored differences in internet access across states and metropolitan areas.
Industry Mix Means That Some Metros and States Might Be More Affected by Remote Work and COVID Stoppages
We assessed former pandemic-scenario estimates from a 2006 Congressional Budget Office (CBO) study to determine the macroeconomic impact of work-from-home shifts that are likely to continue, to some degree, as a response to COVID-19. We applied their estimated decline in labor demand by industry to 2019 U.S. Bureau of Labor Statistics (BLS) employment data. We used these two sources because the CBO report has the most recent estimates for the long-term industry impact of a pandemic while the BLS data set is the most recent one large enough to account for seasonal effects.
To evaluate employment effects, we estimated the concentration of industries that the pandemic influenced to determine areas most and least able to function in remote working postures as well as the internet capacity of the workforce within these regions. We used the BLS’s American Time Use Survey to calculate the share of state and metro workers who could work from home if forced to do so by the pandemic. By examining the relationship between projected impact and ability to work from home, we hope to identify particular areas that are most and least vulnerable to both short-term challenges posed by sheltering in place and long-term workforce reductions.
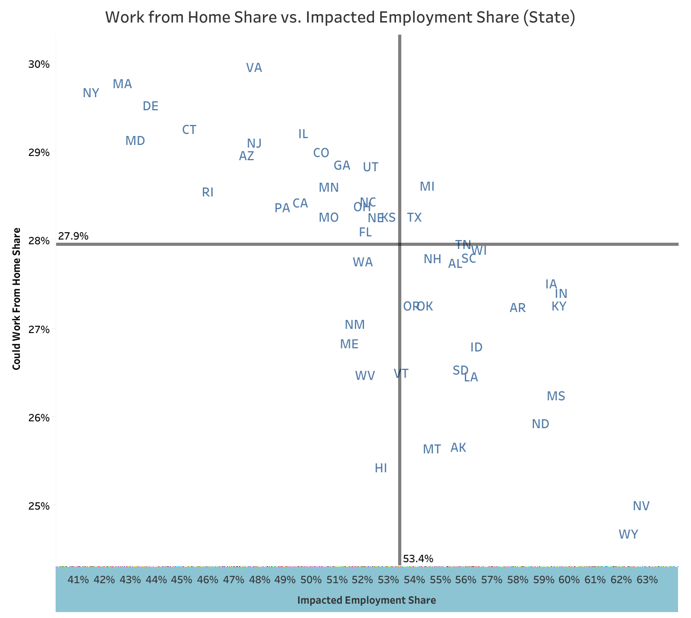
Charts 1 and 2 show metro areas and states plotted by total impact and ability to work from home.
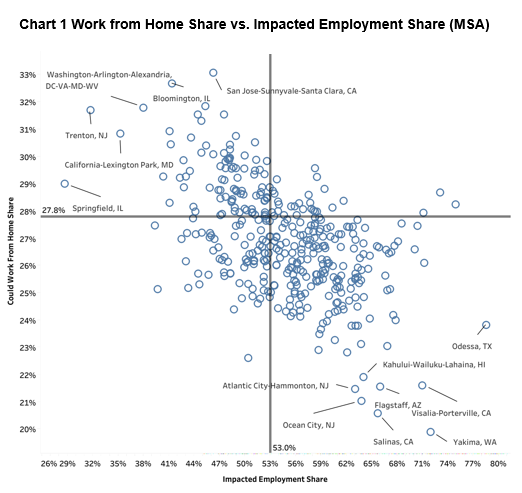
Sources: Congressional Budget Office 2006, A Potential Influenza Pandemic: Possible Macroeconomic and Policy Issues; U.S. Bureau of Labor Statistics’ Quarterly Census of Employment and Wages, 2019 Q1–Q3 data; and U.S. Bureau of Labor Statistics’ American Time Use Survey: 2018 Results.
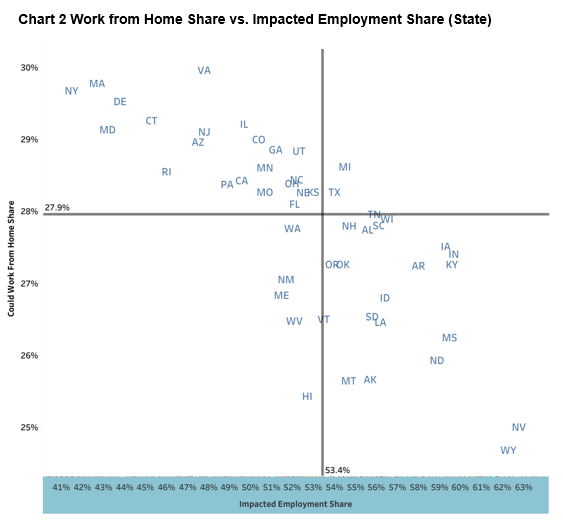
Sources: Congressional Budget Office 2006, A Potential Influenza Pandemic: Possible Macroeconomic and Policy Issues; U.S. Bureau of Labor Statistics’ Quarterly Census of Employment and Wages, 2019 Q1–Q3 data; and Bureau of Labor Statistics’ American Time Use Survey: 2018
The reference lines in each chart represent the average for each measure at that geographic level. We categorized the metros and states with above-average projected pandemic impact and below-average capacity to work from home, shown in the bottom right quadrant in each chart, as the “most vulnerable” to COVID-19-induced economic disruption. The states most negatively affected are Nevada, Wyoming, Arkansas and Mississippi—not surprising, considering the importance of hospitality and tourism sectors in these states. Similarly, regions with significant travel and accommodation sectors or with largely industrial and agricultural areas are less likely to have remote working opportunities (Atlantic City and Ocean City, NJ; Maui, HI; Odessa, TX; and Yakima, WA).
Conversely, we categorized the metros and states with below-average projected pandemic impact and above-average capacity to work from home, shown in the top left quadrant, as the “least vulnerable” to the economic impact of COVID-19. The states most well positioned to weather a work-from-home shift are New York, Massachusetts, Maryland, Delaware, and Connecticut. These states have significant concentrations of financial services, information technology and other knowledge-based clusters, which are more amenable to remote working. Additionally, regions less affected by remote working are—not surprisingly, given the depth of the technology sector—San Jose, CA; Washington, DC; Trenton, NJ; and Springfield, IL (the last two are state capitals and have a higher-than-average share of employment in public administration and professional and technical services).
In general, regions and states whose economy more heavily functions with “on-site” industries like manufacturing, agriculture, construction, tourism, and accommodation and food services are less adaptable to remote work. Conversely, regions with a strong focus on knowledge industries such as finance, insurance, information technology, and professional and technical services are likely to be able to weather long-term work environment shifts brought on by COVID-19.
Broadband and Internet Access (and Subscription Services) Are More Critical Now Than Ever Before
Variation across states and metros in both access to and quality of home internet connections threatens to compound the impact of the gap between affected workers and their capacity to work from home. To measure this variation, we used one-year estimates from the 2018 American Community Survey for households without internet access. Charts 3 and 4 show households without access to the internet at the metro and state level. We see that states and regions in the Southeast and the Dakotas are more likely to not have access to the internet. However, when you look at the metro level, you can see regional disparities of household access within these states. At the metro level, the spatial distribution shows a bias towards smaller metros and metros located in the Southeast and Southwest.
When we examine access through the lens of most and least vulnerable states and metros, we still see significantly high rates of no internet access in households (ranging from 12 percent to 20 percent (see chart 5). We define “most vulnerable” as those economies with above-average impacts on employment demand, below-average capacity to work from home, and below-average rates of home internet access. We define “least-vulnerable” states and regions as those with below-average projected impacts on employment demand, above-average capacity to work from home, and above-average rates of home internet access.
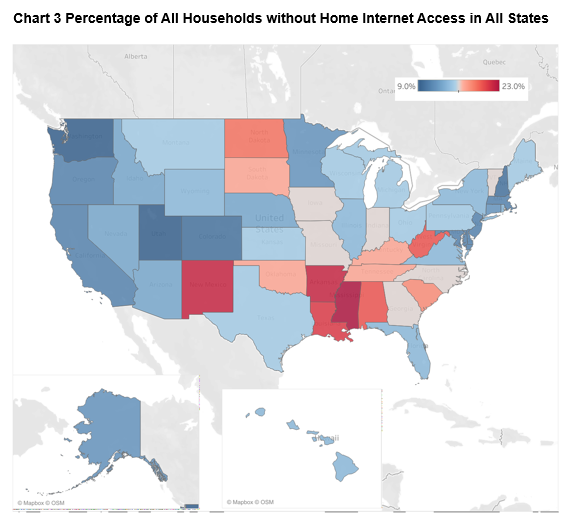
Source: 2018 American Community Survey 1-Year Estimates, Table B2802
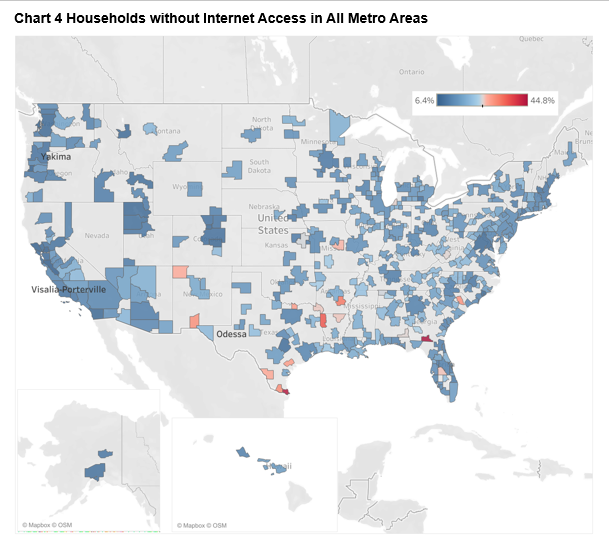
Source: 2018 American Community Survey 1-Year Estimates, Table B2802
Sources: Congressional Budget Office 2006, A Potential Influenza Pandemic: Possible Macroeconomic and Policy Issues; U.S. Bureau of Labor Statistics’ Quarterly Census of Employment and Wages, 2019 Q1-Q3 data; and U.S. Bureau of Labor Statistics’ American Time Use Survey: 2018 Results
Ultimately, we see that even in communities that are very well positioned to prosper in a remote working environment, 12 percent of households have no internet access. To examine this further, we looked at device usage among households to understand where the issue pivots from broadband and internet availability to affordability.
In chart 6, we can see that many states, concentrated in the Southeast, have double-digit percentages of households accessing the internet through cellular devices only. Mississippi has the highest rate of cellular data: just over 20 percent. This high rate of cellular internet access means many people aren’t able to work from home, find new employment opportunities, or, as previously highlighted, even file for unemployment insurance. Internet subscriptions are not an insignificant cost for households that are financially burdened. Even when cost is not an issue, the lack of internet service in a post-COVID-19 world can keep people from finding new opportunities in the labor market.
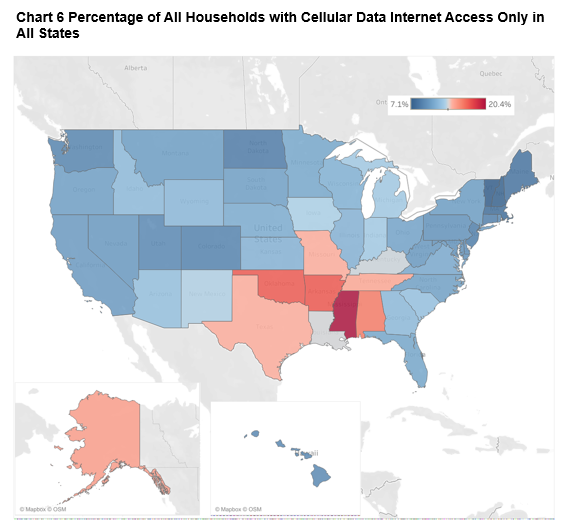
Source: 2018 American Community Survey 1-Year Estimates, Table B2802
What This Means for the Resiliency and Mobility of Both the Economy and Workers
The COVID-19 public health crisis has acutely and maybe even permanently changed the way many of us work. We have good reason to assume that teleworking will continue after the significant economic shocks have subsided and well into recovery. Many major employers in the knowledge economy have allowed most or all of their workforce to work from home in perpetuity. However, as we’ve seen in many states and regions, not all industries do this for the long term. Many communities will need to consider diversifying their industrial mix to strike a balance of on-site and knowledge economy sectors as a way to mitigate their risk against economic downturns and prosper in a post-COVID-19 world. The future of the work environment is still unknown but we are increasingly seeing a future where telework, telelearning, and telehealth are valuable commodities for public health and economic resilience.
However, short- and long-term investments are critical to improving our current state of work and internet access, both through broadband and increased affordability. Below are some suggestions.
Short-term responses
- Expand access via hotspot accessibility. Turn cellular data plans into permanent hotspots to increase household access to the internet.
- Create partnerships with school systems and business community to loan out tech equipment like laptops, desktops, tablets, and other devices to help communities and households that are largely dependent upon cell data for access get internet access.
Long-term investments
- Invest further in broadband access at the national and state levels. This investment could be in the form of public employment, changes to legislation to allow for easier installation of broadband in regions of need, and continued and enhanced Community Reinvestment Act incentives to financially support tech infrastructure in communities.
- Offer formula stipends for internet service subscriptions. This calculation could look similar to determining the free and reduced lunch rate for lower economic status students.
The lack of broadband and internet access in many communities was a problem that existed before the COVID-19 pandemic. The deficit will continue to exacerbate the digital divide and the nation’s ability to have an inclusive economic recover in the emerging work-from-home environment. The approaches this article suggests could help limit the prevalence of remote work deserts and address technological disadvantages for rural and lower socioeconomic populations. The nation’s response to the pandemic has shed a bright light on the need for improved technology and access. Ensuring that we have a system that provides widespread broadband services and lowers barriers to internet access is critical for our economic recovery and the mobility of our workforce.
Stuart Andreason is the director of the Center for Workforce and Economic Opportunity; Pearse Haley is a research analyst; Sarah Miller is a senior adviser; and Mels de Zeeuw is a senior community and economic development analyst.
_______________________________________
1 Y. Han and S. Goetz. (2015). “The economic resilience of U.S. counties during the great recession.” Review of Regional Studies, 45(2), pp.131–49.