Home Ownership Affordability Monitor
Housing plays a critical role in the U.S. economy. For individuals, owning a home may be their most valuable asset. Home ownership helps meet the basic need of shelter and can support economic mobility (through wealth accumulation) and resilience (stability). However, rising home prices and rents have also led to concerns about housing affordability.
Several tools have been developed to provide insight into the extent of the affordable housing challenge. The Atlanta Fed's Southeastern Rental Affordability Tracker provides a point-in-time assessment of the number of households by income category and available rental units by price point to estimate the number and share of cost-burdened renter households and available and affordable units. Other tools show measures of housing affordability over time.* No tool is all-encompassing; there is always a trade-off between the level of detail (both the comprehensiveness of data and its granularity) provided and the frequency of update.
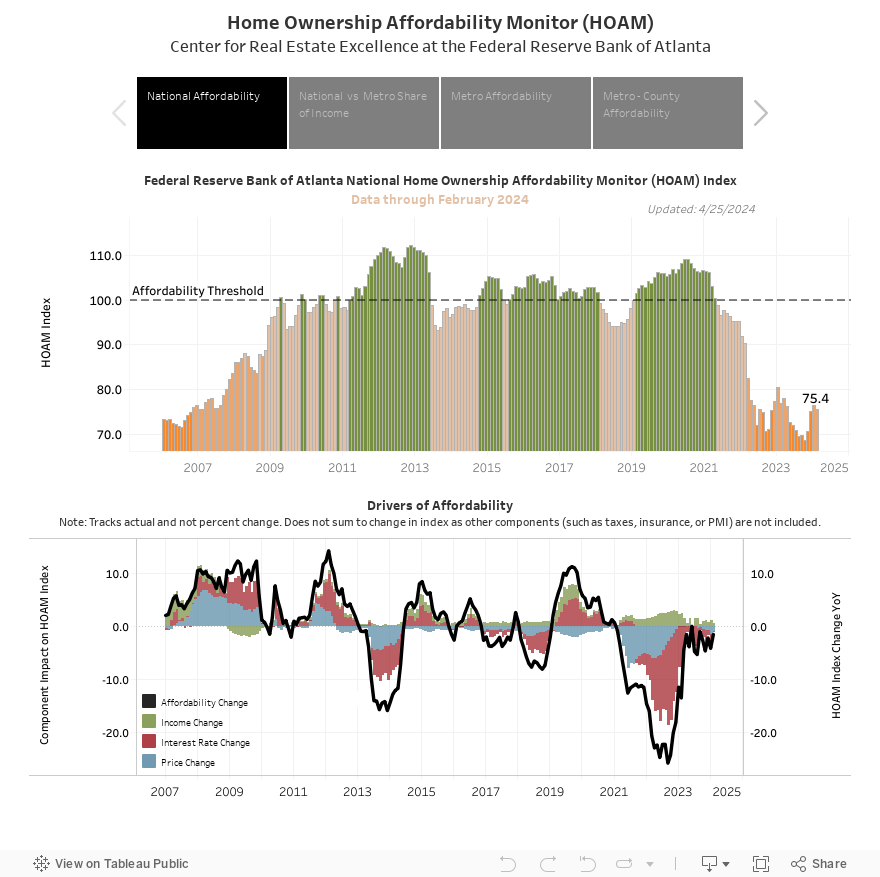
To help business economists and analysts track the relative changes in home ownership affordability at a higher frequency and more granular level of geography, the Atlanta Fed developed an interactive home affordability tool, the HOAM (Home Ownership Affordability Monitor) Index, which measures the ability of a median-income household to absorb the estimated annual costs associated with owning a median-priced home. Using the HUD standard 30 percent share of income threshold to measure affordability, this tool presents a national view of affordability for the median home owner from January 2006 through the most current data as well as metro-level and county-level (within metropolitan areas) views of affordability for the median home owner from January 2014 through the most current data.
The contribution of this tool lies at the intersection of three important factors: (1) it provides a view of the costs associated with home ownership (2) at a higher frequency (monthly), and (3) at finer levels of geography (down to the county level within metropolitan areas).
Stay informed of all HOAM updates by subscribing to our mailing list, subscribing to our RSS feed , or following the Atlanta Fed on Twitter.
* Examples include the widely cited National Association of Realtors' Housing Affordability Index, the affordability map produced by the Joint Center for Housing Studies of Harvard University, the Urban Institute's Housing Affordability for Renters Index, the National Association of Home Builders/Wells Fargo Housing Opportunity Index (HOI), the HUD Exchange Location Affordability Index, the Center for Neighborhood Technology's Housing and Transportation Affordability Index, the U.S. Home Affordability Heat Map produced by ATTOM Data Solutions, and the RealtyHop Housing Affordability Index, to name a few.
Explore the Data
How the Index Works
Click on the different tabs of the dashboard for views on national, metro, and metro-county level housing affordability.
A HOAM index value lower than 100 indicates that the median household income is insufficient to cover the annual costs of owning a median-priced home (the housing cost is greater than 30 percent of income). An index of 100 or greater indicates that the median household income is sufficient to cover the annual costs of owning a median-priced home (the housing cost is less than 30 percent of income).
National Affordability Tab
This dashboard presents two graphs:
- The graph on the top shows the national-level HOAM index from January 2006 through the most current data. Hover over a bar in the chart with the tool tip to see for each time period the median home price, median income, prevailing interest rate, median monthly principal and interest (P&I) payment, total median monthly payment (including P&I, taxes, insurance, and private mortgage insurance [PMI]), and annual total payment share of median income.
- The graph on the bottom presents both a time series of the year-over-year change in the HOAM index (solid black line) and a decomposition of the three main components of the HOAM index—median income (green bar), median price (blue bar), and prevailing interest rate (orange bar)—to illustrate the impact each component has on the change in affordability.
For example, assuming no change in median income, rising home prices and interest rates would have a negative impact on the change in affordability, and declining home prices or interest rates would have a positive impact on the change in affordability. The axis for income is reversed: assuming no change in median home price and interest rate, rising median incomes would improve affordability and be a positive contribution to the change in affordability, while falling median incomes would worsen affordability and be a negative contribution to the change in affordability.
The national affordability decomposition graph shows to what degree changes in income, home prices, or interest rates affect housing affordability. Due to a lack of high-frequency, granular data, private mortgage insurance, property taxes, and property insurance are omitted from the decomposition calculation of what is driving the change in affordability. Because these factors are omitted, the components will not sum to the year-over-year change in the affordability index.
Metro Affordability Tab
This dashboard presents an interactive map of metro-level affordability across the nation as well as lists of the 10 most and least affordable metropolitan areas (with populations of more than 500,000 people).
- Use the interactive map to zoom in from the national view to metro-level affordability. Hover over one of the 636 core-based statistical areas and divisions with the tool tip to see for each area the median home price, median income, median monthly P&I payment, total median monthly payment (including P&I, taxes, insurance, and PMI), and annual total payment share of median income. The view defaults to the most current data, but you can scroll backwards (and forward) to see how these components change over time.
Note: Not all data have been updated to reflect the most recent OMB 18-04 market delineations, so this tool uses the OMB 18-03 (2010) delineation of metropolitan statistical areas.
- The top right-hand list presents the 10 most affordable metropolitan areas with more than 500,000 people, listed in order of their index rank.
- The bottom right-hand list presents the 10 least affordable metropolitan areas with more than 500,000 people, listed in reverse order of their index rank.
County Affordability Tab
This dashboard presents an interactive county-level affordability map, within metropolitan areas, on the left-hand side and a corresponding time-series graph on the right-hand side.
- Use the interactive map to select one of 636 core-based statistical areas and divisions from a drop-down list. The map will update to show the county-level variation in affordability within the selected metro area. Hover over a county with the tool tip to view for each area the median home price, median income, median monthly P&I payment, total median monthly payment (including P&I, taxes, insurance, and PMI), and annual total payment share of median income. The view defaults to the most current data, but you can scroll backwards (and forward) to see how these components change over time.
Note: Not all data have been updated to reflect the most recent OMB 18-04 market delineations, so this tool uses the OMB 18-03 (2010) delineation of metropolitan statistical areas.
- The bar chart presents a metro-level time series that allow the user to track changes in affordability over time.
Data Definitions and Sources
This tool relies on the following data inputs and assumptions:
HOAM Index Input |
Description |
Source |
Median household income (a) |
Median |
U.S. Census Bureau's American Community Survey one-year estimates |
Median existing home price (b) |
Median, monthly three-month moving average |
CoreLogic |
Interest rate (c) |
30-year fixed-rate mortgage—commitment rate, monthly |
Freddie Mac Primary Mortgage Market Survey/Moody's Analytics |
Property taxes (d) |
State- and county-level (median, annual) |
U.S. Census Bureau's American Community Survey (ACS) one-year estimates |
Property insurance (e) |
State- and county-level (average, annual) |
SNL Financial/S&P Global Market Intelligence |
Down payment (f) |
10% of home price |
Black Knight Financial Services |
Private mortgage insurance (PMI) (g) |
0.558% of home mortgage amount |
Federal Housing Finance Agency |
For more detail, please see the definitions below.
- a. Median household income: The U.S. Census Bureau's American Community Survey (ACS) one-year estimates produce household income measures, which include the incomes of the head of household and anyone else in the household who is 15 years or older, regardless of the relationship to the head of household. The median represents the midpoint income within the distribution of incomes, meaning 50 percent of households earn more and 50 percent earn less.
While the incomes are based on household estimates from the ACS, they are projected to the current month by Atlanta Fed staff using additional data series produced by the Current Population Survey and Decennial Census. See the Frequently Asked Questions for more detail about methods used.
Note: Some have argued that housing affordability should be calculated using family income, instead of household income, because "nonfamily households are not typically buyers." There is more recent evidence, however, that suggests the single-person household is on the rise. Because of this trend, this tool incorporates household income estimates. The distinction is important because median household incomes are typically lower than median family incomes, which has direct implications for affordability measures.
- b. Median existing home price: The CoreLogic data reflect the three-month moving average of the median home price for repeat sales observations of all single-family attached and detached properties combined, excluding distressed properties (such as short sales, real estate owned, and foreclosures) for the geography and period specified. The median existing home price represents the midpoint price within the observed repeat sales home prices for the reporting period.
- c. Interest rate: Using the Freddie Mac Primary Mortgage Market Survey and Moody's Analytics as sources, the current 30-year fixed mortgage rate is derived from a weekly survey and based on first-lien prime conventional conforming home purchase mortgages. These mortgages have a loan-to-value of 80 percent, which differs from the loan-to-value of 90 percent in HOAM.
- d. Property taxes: Like many other affordability tools, HOAM relies on the American Community Survey one-year estimates for data on state and local property taxes. Taxes are conditioned on ownership of property and measured by its value. According to the ACS description, this includes "general property taxes related to property as a whole, real and personal, tangible or intangible, whether taxed at a single rate or at classified rates, and taxes on selected types of property, such as motor vehicles, or on certain or all intangibles."
- e. Property insurance: The SNL Financial and S&P Global Market Intelligence data reflect the estimated average annual premium of residential insurance policies per household.
- f. Down payment: This tool assumes a 10 percent down payment. According to Black Knight Financial Services, the average loan-to-value on mortgages originated between 2000 and 2019 fluctuated around 90 percent.
- g. Private mortgage insurance: The private mortgage insurance estimate is determined by averaging the published Federal Housing Finance Agency's g-fees from 2013 to 2018.
- Note: this tool uses median payment to median income ratio of 30 percent.
Calculations
Total monthly cost = (P & I) + PMI ((median home price x .9) x .00558) + taxes ((county- or state-level rate x median home price)/12) + insurance ((county- or metro-level rate x median home price)/12)
Monthly principal and interest payment (P&I) = median home price x 0.9 x (interest rate/12)/ (1-(1/ (1+interest rate/12)^360))
Total annual cost = total monthly cost x 12
Annual share of income = total annual cost/median household income
Affordability threshold income (ATI) = total monthly cost x 3.33 x 12
Index value = (median income / ATI) x 100
Frequently Asked Questions
How do you define "affordability"?
Affordability is considered a HOAM (Home Ownership Affordability Monitor) index value of greater than 100, or when all monetary components of housing costs account for less than 30 percent of median household income.
How did you project the median household income?
For metropolitan areas and the United States, there is a two-step projection process:
- Multivariate linear regression based upon employment levels, unemployment rate, and a time factor to predict income to the most recently available employment and unemployment rate data (lags approximately two to three months).
- Univariate regression over time on actual (not projections, like above) income data to determine trend of the data. Projections add the trend plus a variation factor onto the most recent data point.
For counties, we use the same process as univariate regression above.
Will this tool tell if owning a home is affordable for me?
No. This tool looks at whether a household earning the median income for its area can afford to own a home that costs the median price for homes in that area. If a household earns less than the median income, then owning the median-priced home in that area would not be affordable, regardless of whether the HOAM Index indicates that an area is affordable.
Key Contacts
Domonic Purviance
Senior Financial Specialist, Residential Real Estate
Domonic.Purviance@atl.frb.org
(404) 498-7968
Center for Housing and Policy
RealEstateCenter@atl.frb.org