The Mortgage Analytics and Performance Dashboard (MAPD) has received its final update with data through December 2021. MAPD is preserved here for historical purposes.
Mortgage Analytics and Performance Dashboard
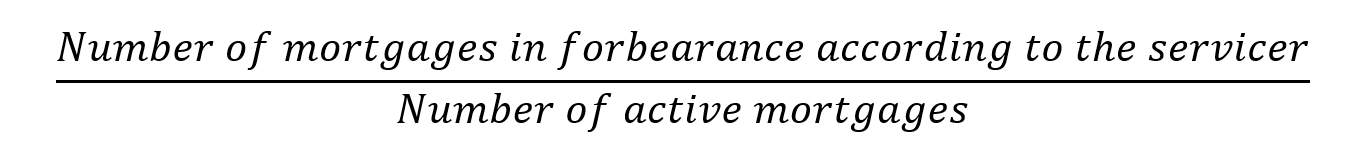
The Mortgage Analytics and Performance Dashboard (MAPD) gives policymakers at the national, state, and local levels the ability to see where owner-occupant homeowners in their jurisdictions have fallen behind on mortgage payments or used mortgage forbearance as a means of economic relief during the COVID-19 pandemic.
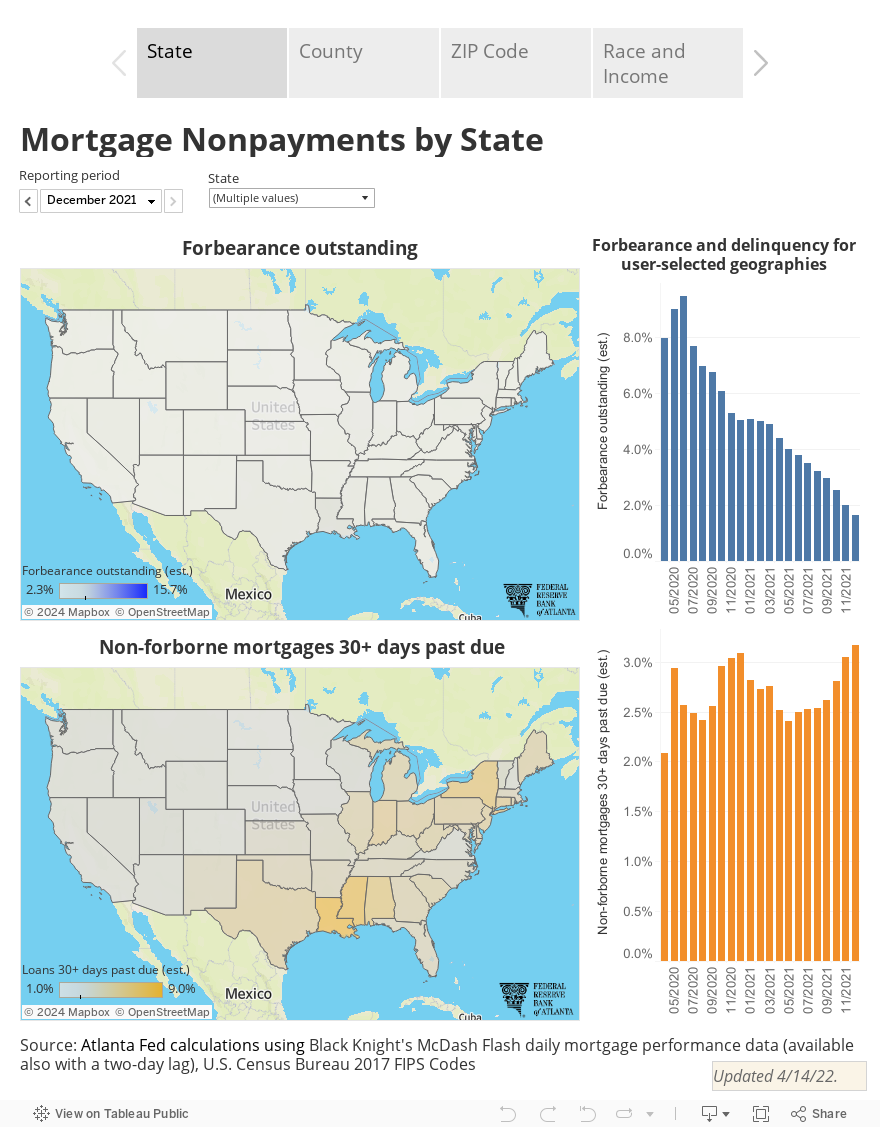
In the previous recession, tracking mortgage delinquency measures was one of the primary methods for understanding the amount of distress in the mortgage market. Unlike the previous downturn, where there was no uniform and widespread response, mortgage forbearance has been one of many tools used by the federal government to provide economic relief to U.S. homeowners. Mortgage forbearance is a policy that provides borrowers the flexibility to miss mortgage payments without immediate penalty during a specified period, normally six months. These missed payments usually are rolled into a repayment plan of some kind after the forbearance period has ended. Forbearance is typically available to borrowers experiencing temporary hardship, and historically it has been used only in areas where homeowners suffer from natural disasters such as hurricanes.
On March 10, 2020, the Federal Housing Finance Agency, which regulates Fannie Mae and Freddie Mac, released a public statement encouraging mortgage borrowers nationwide to take advantage of forbearance programs in light of the growing economic impact of COVID-19. Borrowers whose loans are not backed by Fannie Mae or Freddie Mac were also offered forbearance plans similar to those offered by the government-sponsored enterprises. By the end of April 2020, nearly 4.5 million mortgages in the United States were in forbearance.
In addition to the extended payment plan for missed payments, mortgage servicers generally do not report missed payments to credit bureaus when a mortgage is in forbearance. (A mortgage servicer is the company responsible for administering the payment plan for mortgages; it is sometimes the lender and sometimes a third party.)
The Mortgage Analytics and Performance Dashboard uses Black Knight's McDash Flash daily mortgage performance data (available also from Black Knight with a two-day lag) to identify forbearance. The tool previously used the Equifax and Black Knight McDash Credit Risk Insight Mortgage Servicing (CRISM) data set to estimate forbearance rates; the current data set went into effect in March 2021. The addition of the Flash data set was made possible through collaboration with Xudong An, Larry Cordell, Liang Geng, and Keyoung Lee at the Federal Reserve Bank of Philadelphia.
Explore the Data
How the Dashboard Works
The dashboard presents two maps and two bar charts. The map and chart on the top, in shades of blue, illustrate the share of outstanding first mortgages in forbearance. The map and chart on the bottom, in shades of orange, illustrate the share of outstanding first mortgages that are 30 or more days past due and are not in forbearance. Users can select the geography (state or core-based statistical area) and time period of interest. The map displays the share of mortgages that are delinquent by month down to the ZIP code level. The "Race and Income" tab gives users the ability to cross-reference the mortgage performance data with race and income data from the U.S. Census Bureau's American Community Survey.
The user can select the level of aggregation. For example, if the user selects Georgia and Alabama in the control panel, the time-series bar chart will reflect aggregated forbearance and delinquency rates as defined above for the whole of Georgia and Alabama.
Data Definitions and Sources
The loans in this data set are taken from Black Knight's McDash Flash daily mortgage performance data set. The rate of forbearance is defined as:

We define an active mortgage as one that is current or in any state of delinquency (according to the servicer). We also limit the analysis to first mortgages (no second liens) with an owner-occupant, and we exclude any ZIP code months with fewer than 50 loans meeting these criteria.
The delinquency rate is defined in each ZIP code month as the fraction of active loans that is past due but not in forbearance. In this case, the borrower has not paid his or her mortgage, and we do not identify the borrower as being in forbearance.
In this tool, the following definitions apply:
Active loans are defined as owner-occupant first mortgages that are either current or delinquent.
The rate of forbearance is equal to the fraction of active loans that are in forbearance, according to the servicer.
The rate of delinquency is equal to the fraction of active loans that are delinquent and not in forbearance, according to the servicer.
In the "Race and Income" view, the "Minority share" is defined as the estimated fraction of individuals, according to the most recent Census data, who are Hispanic and/or non-white. The "Low- to moderate-income share" is the estimated fraction of individuals, according to the most recent Census data, with household income at or below 80 percent of the area median income (AMI).
These rates are reported for the relevant geography selected by the user. Each ZIP code in the map reports the rates of forbearance and delinquency for that ZIP code; the time-series bar charts show the aggregate rates of forbearance and delinquency for all ZIP codes in the geography selected in the control panel. Please be advised that the race and income information is provided only in the ZIP code view.
Related Research
Gerardi, K., C. Hudson, L. Loewenstein, and P. Willen. 2020 (July 2). "An Update on Forbearance Trends." Real Estate Research, Federal Reserve Bank of Atlanta.
Contact Us

Daniel Sexton
Quantitative Specialist
daniel.sexton@atl.frb.org

Jessica Dill
Director of Center for Housing and Policy
jessica.dill@atl.frb.org